Histone H3K9 modifications are a local chromatin event involved in ethanol-induced neuroadaptation of the NR2B gene - PubMed (original) (raw)
Histone H3K9 modifications are a local chromatin event involved in ethanol-induced neuroadaptation of the NR2B gene
Mei Qiang et al. Epigenetics. 2011.
Abstract
Expression of the NMDA receptor 2B (NR2B) gene is upregulated following chronic intermittent ethanol (CIE) treatment and withdrawal, which underlies behavioral alterations in addiction. The goal of this study was to characterize the changes of histone modifications induced by CIE treatment and its subsequent removal associated to the upregulation of NR2B gene transcription. To investigate the involvement of histone acetylation in the effect of ethanol on the NR2B gene, we examined the influence of CIE on histone acetylation in the 5' regulatory region of NR2B using a qChIP assay. CIE treatment and its subsequent removal produced a remarkable and selected increase in histone H3K9 acetylation. Interestingly, the majority of the increased H3K9 acetylation occurred after ethanol removal, which was coincident with a decrease in H3K9 methylation in the same time duration. Further examination of the mechanisms of ethanol-induced alterations on the histone modifications revealed that CIE-induced acetylation of H3K9 was not due to the changes in global enzyme activities or the expression of histone acetyltransferases (HATs) and deacetylase (HDACs). Instead, we found a significant downregulation in some histone methyltransferases (HMTs) at both the global level and the local chromatin of the NR2B gene following CIE treatment. Moreover, our experiments also indicated a decrease of G9a, Suv39 h1 and HDAC1-3 in the chromatin of the NR2B gene promoter, which may be responsible for the altered H3K9 modifications. Taken together, the findings suggest a mechanism where the changes in H3K9 modifications in the local chromatin of the NR2B gene underlie alcohol-induced neuroadaptation.
Figures
Figure 1
TSA increases NR2B gene transcription. The cortical neuronal cultures were treated with the histone deacetylase inhibitor TSA at the indicated concentration and duration. For the 24 h treatment, TSA was added to the culture medium and harvested at the end of 24 h. For the 5-day treatment, TSA was added freshly each day with fresh medium. Total RNA was isolated and qPCR was performed to measure NR2B mRNA expression. The expression of GAPDH was used as the internal control. Results are presented as the mean ratio to control ± SEM; *p < 0.05; ***p < 0.001 compared to control levels (one-way ANOVA, F = 42.62, p < 0.0001, post hoc Newman-Keuls post hoc comparison).
Figure 2
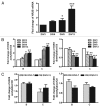
(A) Developmental changes of NR2B gene transcription in primary cultured neurons. Total RNA were isolated from cultured neuronal cells at DIV 3, 6, 8 and 13. Real time PCR was performed to amplify NR2B mRNA expression. The expression of GAPDH was used as the internal control. Values are presented as means ± SEM and represent the fold increases verse the value of DIV 3. *p < 0.05, ***p < 0.001 compared to those in DIV 3. (B) Developmental changes of histone H3-K9 acetylation and dimethylation. The neurons were harvested from same time points and ChIP assay was performed with the anti-Ac-H3K9 and anti-dimethylation-H3K9 antibodies and followed by real time PCR to amplify the two regions on the NR2B promoter (see Fig. S1). Values are presented as means ± SEM and represent the fold increases over the control (control = 1). *p < 0.05, **p < 0.01 and ***p < 0.001 compared to the control. (C) Comparison of the changes of histone H3-K9 acetylation and methylation in response to CIE treatment between DIV 3–7 and DIV 8–13. The cultures were treated with the CIE regimen during DIV 3–7 and DIV 8–13, respectively. Their respective age-matched controls were subjected to the media changes for the same duration. The ChIP assay was performed with the anti-Ac-H3K9 and anti-dimethyl-H3K9 antibodies followed by real time PCR to amplify the two regions on the NR2B promoter. Values are presented as means ± SEM and represent the fold changes over the control (control = 1).
Figure 3
Ethanol-induced changes in histone acetylation. Multiple qChIP assays were performed to examine the acetylation levels of H3 and H4 in Areas B, C and G in the 5′ regulatory region of the NR2B, respectively. There specific antibodies (see Methods) used are indicated in each sub-graph. Data shown are the representatives of 3 separate experiments. Values are presented as means ± SEM and represent the fold change over their corresponding controls (control = 1). *p < 0.05, **p < 0.01 and ***p < 0.001, two-way MANOVA followed by Newman-Keuls post hoc comparison.
Figure 4
Ethanol-induced selective histone H3K9 acetylation. Multiple qChIP assays were performed to examine the acetylation levels of the indicated residues of histone H3 in Areas B, C and G in the 5′ regulatory region of the NR2B, respectively. Specific antibodies (see Methods) used are indicated in each sub-graph. Data shown are the representatives of three separate experiments. Values are presented as means ± SEM and represent the fold change over their corresponding controls (control = 1). *p < 0.05, **p < 0.01 and ***p < 0.001, two-way MANOVA followed by Newman-Keuls post hoc comparison.
Figure 5
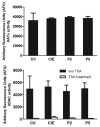
HAT and HDAC activities. Nuclear extracts were prepared and incubated with unmodified histone H3 peptide. HAT and HDAC activity assays were performed and the acetylation level of the peptide was measured. Values are presented as means ± SEM of three separate experiments. p > 0.05 (one-way ANOVA, F = 0.048, p = 0.985).
Figure 6
Ethanol-mediated reduction of histone H3K9Me2 and H3K9Me3 methylation. A to G represent the seven amplified regions by qPCR on the 5′ regulatory area of the NR2B shown as Figure S4. Methylation levels of H3K9Me2 and H3K9Me3 in the NR2B 5′ regulatory region were determined by the qChIP assay with antibodies specific for H3K9 dimehtylation (Upstate, 07-441) and trimethylation (abcam, ab8898), respectively. Values are presented as means ± SEM and represent the fold changes over their corresponding controls. *p < 0.05, **p < 0.01 and ***p < 0.001, two-way MANOVA followed by Newman-Keuls post hoc comparison.
Figure 7
CIE-induced loss of occupancy of G9a and Suv39 h1 at the NR2B promoter. qChIP assays were performed with antibodies specific for histone methyltransferase G9a and Suv39 h1 (abcam, ab40542 and ab12405), respectively. Data shown represent an average of 3 separate experiments. Values are presented as means ± SEM of the fold increase over their corresponding controls (control = 1). *p < 0.05 and **p < 0.01, two-way MANOVA followed by Newman-Keuls post hoc comparison.
Figure 8
CIE-induced loss of occupancy of HDACs to the NR2B 5′ regulatory region. Region B and C are the representative regions in the 5′ regulatory region of the NR2B. The qChIP assays were performed with antibodies to HDAC1-3 (HDAC1 and HDAC2, Active motif, 39532 and 39533; HDAC3, abcam, ab7030) in region B and C. Data shown are representatives of 4 separate experiments. Values are presented as means ± SEM and represent the fold increase over their corresponding controls (control = 1). *p < 0.05 and **p < 0.01, two-way MANOVA followed by Newman-Keuls post hoc comparison.
Figure 9
CIE-induced loss of co-occupancy of Suv39 h1 and HDACs to chromatin at the NR2B 5′ regulatory region. B and C are the representative regions in the 5′ regulatory region of the NR2B described in Figure S1. qRe-ChIP assays were performed with antibodies against Suv39 h1 and HDAC1-3. Data shown are representatives of the mean of 3 separate experiments. Values are presented as means ± SEM and represent the fold increases over their corresponding controls (control = 1). *p < 0.05 and **p < 0.01, two-way ANOVA followed by Newman-Keuls post hoc comparison.
Similar articles
- Correlation between the epigenetic modification of histone H3K9 acetylation of NR2B gene promoter in rat hippocampus and ethanol withdrawal syndrome.
Li D, Zhang Y, Zhang Y, Wang Q, Miao Q, Xu Y, Soares JC, Zhang X, Zhang R. Li D, et al. Mol Biol Rep. 2019 Jun;46(3):2867-2875. doi: 10.1007/s11033-019-04733-7. Epub 2019 Mar 22. Mol Biol Rep. 2019. PMID: 30903572 - The site specific demethylation in the 5'-regulatory area of NMDA receptor 2B subunit gene associated with CIE-induced up-regulation of transcription.
Qiang M, Denny A, Chen J, Ticku MK, Yan B, Henderson G. Qiang M, et al. PLoS One. 2010 Jan 20;5(1):e8798. doi: 10.1371/journal.pone.0008798. PLoS One. 2010. PMID: 20098704 Free PMC article. - Epigenetic mechanisms are involved in the regulation of ethanol consumption in mice.
Qiang M, Li JG, Denny AD, Yao JM, Lieu M, Zhang K, Carreon S. Qiang M, et al. Int J Neuropsychopharmacol. 2014 Oct 31;18(2):pyu072. doi: 10.1093/ijnp/pyu072. Int J Neuropsychopharmacol. 2014. PMID: 25522411 Free PMC article. - Epigenetic landscape of amphetamine and methamphetamine addiction in rodents.
Godino A, Jayanthi S, Cadet JL. Godino A, et al. Epigenetics. 2015;10(7):574-80. doi: 10.1080/15592294.2015.1055441. Epigenetics. 2015. PMID: 26023847 Free PMC article. Review. - Histone acetylation modifiers in the pathogenesis of malignant disease.
Mahlknecht U, Hoelzer D. Mahlknecht U, et al. Mol Med. 2000 Aug;6(8):623-44. Mol Med. 2000. PMID: 11055583 Free PMC article. Review.
Cited by
- Disconnect between alcohol-induced alterations in chromatin structure and gene transcription in a mouse embryonic stem cell model of exposure.
Veazey KJ, Wang H, Bedi YS, Skiles WM, Chang RC, Golding MC. Veazey KJ, et al. Alcohol. 2017 May;60:121-133. doi: 10.1016/j.alcohol.2017.01.007. Epub 2017 Jan 11. Alcohol. 2017. PMID: 28433419 Free PMC article. - An Overview of Epigenetics in Obesity: The Role of Lifestyle and Therapeutic Interventions.
Mahmoud AM. Mahmoud AM. Int J Mol Sci. 2022 Jan 25;23(3):1341. doi: 10.3390/ijms23031341. Int J Mol Sci. 2022. PMID: 35163268 Free PMC article. Review. - The histone demethylase KDM6B in the medial prefrontal cortex epigenetically regulates cocaine reward memory.
Zhang YX, Akumuo RC, España RA, Yan CX, Gao WJ, Li YC. Zhang YX, et al. Neuropharmacology. 2018 Oct;141:113-125. doi: 10.1016/j.neuropharm.2018.08.030. Epub 2018 Aug 27. Neuropharmacology. 2018. PMID: 30165076 Free PMC article. - Epigenetic mechanisms underlying pathobiology of alcohol use disorder.
Dulman RS, Wandling GM, Pandey SC. Dulman RS, et al. Curr Pathobiol Rep. 2020 Sep;8(3):61-73. doi: 10.1007/s40139-020-00210-0. Epub 2020 Jul 29. Curr Pathobiol Rep. 2020. PMID: 33747641 Free PMC article. - Alignment of the transcriptome with individual variation in animals selectively bred for High Drinking-In-the-Dark (HDID).
Hitzemann R, Oberbeck D, Iancu O, Darakjian P, McWeeney S, Spence S, Schlumbohm J, Metten P, Crabbe J. Hitzemann R, et al. Alcohol. 2017 May;60:115-120. doi: 10.1016/j.alcohol.2017.02.176. Epub 2017 Apr 12. Alcohol. 2017. PMID: 28442218 Free PMC article.
References
- Kumari M, Ticku MK. Regulation of NMDA receptors by ethanol. Prog Drug Res. 2000;54:152–189. - PubMed
- Ron D, Jurd R. The “ups and downs” of signaling cascades in addiction. Sci STKE. 2005;2005:14. - PubMed
- Krystal JH, Petrakis IL, Mason G, Trevisan L, D'Souza DC. N-methyl-D-aspartate glutamate receptors and alcoholism: reward, dependence, treatment and vulnerability. Pharmacol Ther. 2003;99:79–94. - PubMed
- Khanna JM, Shah G, Weiner J, Wu PH, Kalant H. Effect of NMDA receptor antagonists on rapid tolerance to ethanol. Eur J Pharmacol. 1993;230:23–31. - PubMed
- Holter SM, Danysz W, Spanagel R. Novel uncompetitive N-methyl-D-aspartate (NMDA)-receptor antagonist MRZ 2/579 suppresses ethanol intake in long-term ethanol-experienced rats and generalizes to ethanol cue in drug discrimination procedure. J Pharmacol Exp Ther. 2000;292:545–552. - PubMed
Publication types
MeSH terms
Substances
LinkOut - more resources
Full Text Sources
Miscellaneous


