Pancreatic β-cell prosurvival effects of the incretin hormones involve post-translational modification of Kv2.1 delayed rectifier channels - PubMed (original) (raw)
Pancreatic β-cell prosurvival effects of the incretin hormones involve post-translational modification of Kv2.1 delayed rectifier channels
S-J Kim et al. Cell Death Differ. 2012 Feb.
Abstract
Glucose-dependent insulinotropic polypeptide (GIP) and glucagon-like peptide-1 (GLP-1) are the major incretin hormones that exert insulinotropic and anti-apoptotic actions on pancreatic β-cells. Insulinotropic actions of the incretins involve modulation of voltage-gated potassium (Kv) channels. In multiple cell types, Kv channel activity has been implicated in cell volume changes accompanying initiation of the apoptotic program. Focusing on Kv2.1, we examined whether regulation of Kv channels in β-cells contributes to the prosurvival effects of incretins. Overexpression of Kv2.1 in INS-1 β-cells potentiated apoptosis in response to mitochondrial and ER stress and, conversely, co-stimulation with GIP/GLP-1 uncoupled this potentiation, suppressing apoptosis. In parallel, incretins promoted phosphorylation and acetylation of Kv2.1 via pathways involving protein kinase A (PKA)/mitogen- and stress-activated kinase-1 (MSK-1) and histone acetyltransferase (HAT)/histone deacetylase (HDAC). Further studies demonstrated that acetylation of Kv2.1 was mediated by incretin actions on nuclear/cytoplasmic shuttling of CREB binding protein (CBP) and its interaction with Kv2.1. Regulation of β-cell survival by GIP and GLP-1 therefore involves post-translational modifications (PTMs) of Kv channels by PKA/MSK-1 and HAT/HDAC. This appears to be the first demonstration of modulation of delayed rectifier Kv channels contributing to the β-cell prosurvival effects of incretins and of 7-transmembrane G protein-coupled receptor (GPCR)-stimulated export of a nuclear lysine acetyltransferase that regulates cell surface ion channel function.
Figures
Figure 1
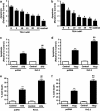
K+ channels contribute to STS- and Thap-induced apoptosis in INS-1 _β_-cells (a and b). Effect of TEA on STS or Thap-induced INS-1 _β_-cell apoptosis. _β_-INS-1 (832/13) cells were treated with STS (100 nM, a) or Thap (1 _μ_M, b) in the presence or absence of TEA (0 to 40 mM) for 6 h and apoptotic cells were determined using the APOPercentage apoptosis assay kit as described in Materials and methods. (c–f). Effect of Kv2.1 overexpression on STS- or Thap-induced apoptotic cell death. INS-1 (832/13) _β_-cells were transfected with Kv2.1 or pcDNA3 and treated with STS (100 nM, c and e) or Thap (1 _μ_M, d and f) for 6 h. _β_-cell apoptosis (c and d) and _β_-cell death (e and f) were determined as described in Materials and Methods. Significance was tested using ANOVA with Newman–Keuls post hoc test; *represents P<0.05 versus STS alone, #represents P<0.05 versus Thap alone, **represents P<0.05 versus pcDNA Control, ##represents P<0.05 versus pcDNA plus STS, and &&represents P<0.05 versus pcDNA plus Thap
Figure 2
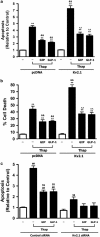
GIP and GLP-1 reduce apoptosis potentiated by Kv2.1 overexpression. (a) Effects of GIP and GLP-1 on Thap-induced INS-1 _β_-cell apoptosis. INS-1 (832/13) _β_-cells were transfected as described above and treated with Thap (1 _μ_M) for 6 h in the presence or absence of GIP (1–42, 100 nM) or GLP-1 (7–36, 100 nM). Apoptotic cells were quantified using the APOPercentage apoptosis assay kit. (b) Effects of GIP and GLP-1 on Thap-induced INS-1 _β_-cell death. INS-1 _β_-cells were treated as described above and _β_-cell death was measured using a high-throughput CellomicsArrayscan V automated imager, as described in Materials and Methods. (c) Effect of Kv2.1 siRNA on Thap-induced INS-1 _β_-cell death. INS-1 _β_-cells were transfected with Kv2.1 siRNA or Control scrambled siRNA (100 nM), and incubated for 72 h, as described in Materials and methods. Cells were treated with Thap (1 _μ_M) for 6 h in the presence or absence of GIP (1–42, 100 nM) or GLP-1 (7–36, 100 nM). Apoptotic cells were quantified using the APOPercentage apoptosis assay kit. Significance was tested using ANOVA with Newman–Keuls post hoc test, where ** represents P<0.05 _versus_ pcDNA Control, &&represents _P_<0.05 _versus_ pcDNA plus Thap, ^^represents _P_<0.05 _versus_ Kv2.1 plus Thap, ##represents _P_<0.05 _versus_ Control siRNA, and represents P<0.05 versus Control siRNA plus Thap
Figure 3
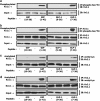
GIP and GLP-1 increase phosphorylation and acetylation of Kv2.1. (a–d) Effect of GIP/GLP-1 on phosphorylation and acetylation of Kv2.1. INS-1 _β_-cells were transfected with Kv2.1 and incubated with 100 nM of indicated peptides, GIP (1–42), GIP analog (19–30), GLP-1 (7–36) or GLP-1 analog (9–36) for 1 h. Total cellular protein extracts were isolated from each sample and immunoprecipitated (IP) with phospho-Ser/Thr (a), Kv2.1 (b and d) or acetyl-Lys (c) followed by immunoblotting (IB) for Kv2.1 (a and c), phospho-Ser/Thr (b) or acetyl-Lys (d). Input represents one-tenth of total protein extract used in the Co-IP assay. Western blots are representative of _n_=3
Figure 4
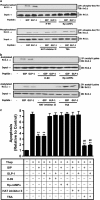
PKA/MSK-1 and HAT/HDAC are involved in incretin-mediated PTMs of Kv 2.1 and _β_-cell survival. (a and b) Effect of inhibiting PKA/MSK-1 or HAT/HDAC on PTMs of Kv 2.1. INS-1 _β_-cells were transfected with Kv2.1 and stimulated with 100 nM of GIP (1–42) or GLP-1 (7–36) in the presence or absence of PKA/MSK-1 inhibitor, H-89 (10 _μ_M), a competitive inhibitor of PKA, Rp-cAMPs (200 _μ_M), HAT inhibitor, HAT inhibitor II (40 _μ_M) or HDAC inhibitor and Trichostatin A (TSA, 300 nM). Protein extracts were isolated from each sample and IP with phospho-Ser/Thr (a) or acetyl-Lys (b) followed by IB for Kv2.1. Input represents one-tenth of total protein extract used in the Co-IP assay. (c) Effect of inhibiting PKA/MSK-1 or HAT/HDAC on incretin-mediated _β_-cell survival. INS-1 _β_-cells were transfected with Kv2.1 and treated with Thap (1 _μ_M) for 6 hs in the presence or absence of GIP (1–42, 100 nM), GLP-1 (7–36, GLP-1 (7–36), PKA/MSK-1 inhibitor, H-89 (10 _μ_M), a competitive inhibitor of PKA, Rp-cAMPs (200 _μ_M), HAT inhibitor, HAT inhibitor II (40 _μ_M), or HDAC inhibitor, Trichostatin A (TSA, 300 nM). Apoptotic cell death was determined using the APOPercentage apoptosis assay kit as described in Materials and methods. Significance was tested using ANOVA with Newman–Keuls post hoc test, where ** represents P<0.05 versus Thap, and ##represents P<0.05 versus Thap plus GIP or GLP-1
Figure 5
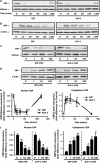
GIP and GLP-1 export nuclear CBP to cytoplasm. (a–d) Time course (a and b) and concentration–response effect (c and d) of GIP/GLP-1 on nuclear (a and c) and cytoplasmic (b and d) CBP. INS-1 _β_-cells were treated for the indicated periods of time with GIP or GLP-1 (100 nM) in the time course studies, or for 1 h with varying concentrations of GIP or GLP-1 in the concentration–response studies. Western blot analyses were performed on nuclear (a and c) or cytoplasmic (b and d) fractions using antibodies against CBP, histone and _β_-actin. (e and f) Densitometric analysis of (a–d). western blots were quantified and normalized with the loading control, histone or _β_-actin. Shown are fold differences versus Control. (g and h). Concentration–response effect of GIP/GLP-1 on nuclear (e) and cytoplasmic (f) CBP. Human islets were treated for 1 h with varying concentrations of GIP or GLP-1. Western blot analyses were performed on nuclear (e) or cytoplasmic (f) fractions using antibodies against CBP, histone and _β_-actin. (i) Confocal Microscopy. INS-1 _β_-cells were treated as described above and incubated with GIP or GLP-1 (100 nM) for 1 h. Immunocytochemical staining was performed using antibodies against CBP (red) and nuclei were stained with DAPI (blue). The scale bar indicates 20 _μ_m and all imaging data were analyzed using the EZC1 software. (j and k) Time course effect (j) and concentration–response effect (k) of GIP/GLP-1 on nuclear p300. INS-1 _β_-cells were treated for the indicated periods of time with GIP or GLP-1 (100 nM) in the time course studies, or for 1 h with varying concentrations of GIP or GLP-1 in the concentration–response studies. Western blot analyses were performed on nuclear fractions using antibodies against p300, histone and _β_-actin. Western blots are representative of _n_=3 and significance was tested using ANOVA with Newman–Keuls post hoc test, where ** represents P<0.05 versus GIP Control, #represents P<0.05 versus GLP-1 Control
Figure 6
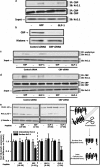
CBP is responsible for GIP/GLP-1-mediated acetylation of Kv2.1. (a) Co-immunoprecipitation (Co-IP). Human islets were treated with GIP or GLP-1 (100 nM) for 1 h. Cytoplasmic extracts were isolated from each sample and IP with CBP followed by IB for Kv2.1. Input represents one-tenth of total cytoplasmic extract used in the Co-IP assay. (b) Effects of CBP siRNA on nuclear expression of CBP. INS-1 _β_-cells transfected with CBP siRNA or Control scrambled siRNA (100 nM), and incubated for 72 h. Western blot analyses were performed as described in Materials and Methods, using antibody against CBP, histone and _β_-actin. (c) Effects of CBP siRNA on GIP/GLP-1 mediated acetylation of Kv2.1. _β_-INS-1 cells were transfected with Kv2.1 and CBP siRNA, and incubated with GIP or GLP-1 (100 nM) for 1 h. Cytoplasmic extracts were isolated from each sample and IP with Kv2.1 followed by IB for acetyl-Lys. Input represents one-tenth of total protein extract used in the Co-IP assay. (d) Effects of CBP siRNA on GIP/GLP-1 mediated protein–protein interaction between Kv2.1 and CBP. INS-1 _β_-cells were transfected with Kv2.1 and siRNA as described above, and incubated with GIP or GLP-1 (100 nM) for 1 h. Cytoplasmic extracts were isolated from each sample and IP with CBP followed by IB for Kv2.1. Input represents one-tenth of total cytoplasmic extract used in the Co-IP assay. (e) Effects of GIP and GLP-1 on Kv2.1 surface expression. Human islet cells were treated with 100 nM of indicated peptides, GIP (1–42), GIP analog (19–30), GLP-1 (7–36) and GLP-1 analog (9–36) for 1 h. Proteinase K was applied for 30 min, and cell lysates were analyzed for Kv 2.1 by SDS-PAGE and IB as described in Proteinase K digestion experiments of Materials and methods. The arrow labeled S indicates the immunoblot position of surface Kv2.1, and the arrow labeled I indicates the intracellular Kv2.1. (f) Densitometric analysis of (e). Western blots were quantified and normalized with the loading control, _β_-tubulin. Shown are fold differences _versus_—Control. Western blots are representative of _n_=3 and significance was tested using ANOVA with Newman–Keuls post hoc test, where ** represents P<0.05 _versus_—Control
Similar articles
- Incretin-stimulated interaction between β-cell Kv1.5 and Kvβ2 channel proteins involves acetylation/deacetylation by CBP/SirT1.
Kim SJ, Ao Z, Warnock G, McIntosh CH. Kim SJ, et al. Biochem J. 2013 Apr 15;451(2):227-34. doi: 10.1042/BJ20121669. Biochem J. 2013. PMID: 23390957 - Glucose-dependent insulinotropic polypeptide and glucagon-like peptide-1 modulate beta-cell chromatin structure.
Kim SJ, Nian C, McIntosh CH. Kim SJ, et al. J Biol Chem. 2009 May 8;284(19):12896-904. doi: 10.1074/jbc.M809046200. Epub 2009 Mar 11. J Biol Chem. 2009. PMID: 19279000 Free PMC article. - Cav1.2 and Cav1.3 are differentially coupled to glucagon-like peptide-1 potentiation of glucose-stimulated insulin secretion in the pancreatic beta-cell line INS-1.
Jacobo SM, Guerra ML, Hockerman GH. Jacobo SM, et al. J Pharmacol Exp Ther. 2009 Nov;331(2):724-32. doi: 10.1124/jpet.109.158519. Epub 2009 Aug 26. J Pharmacol Exp Ther. 2009. PMID: 19710366 Free PMC article. - Two incretin hormones GLP-1 and GIP: comparison of their actions in insulin secretion and β cell preservation.
Yabe D, Seino Y. Yabe D, et al. Prog Biophys Mol Biol. 2011 Nov;107(2):248-56. doi: 10.1016/j.pbiomolbio.2011.07.010. Epub 2011 Jul 28. Prog Biophys Mol Biol. 2011. PMID: 21820006 Review. - Anti-diabetic actions of glucagon-like peptide-1 on pancreatic beta-cells.
Lee YS, Jun HS. Lee YS, et al. Metabolism. 2014 Jan;63(1):9-19. doi: 10.1016/j.metabol.2013.09.010. Epub 2013 Oct 17. Metabolism. 2014. PMID: 24140094 Review.
Cited by
- Molecular mechanism responsible for sex differences in electrical activity of mouse pancreatic β cells.
Jacobo-Piqueras N, Theiner T, Geisler SM, Tuluc P. Jacobo-Piqueras N, et al. JCI Insight. 2024 Feb 15;9(6):e171609. doi: 10.1172/jci.insight.171609. JCI Insight. 2024. PMID: 38358819 Free PMC article. - Telmisartan Potentiates Insulin Secretion via Ion Channels, Independent of the AT1 Receptor and PPARγ.
Liu T, Cui L, Xue H, Yang X, Liu M, Zhi L, Yang H, Liu Z, Zhang M, Guo Q, He P, Liu Y, Zhang Y. Liu T, et al. Front Pharmacol. 2021 Sep 14;12:739637. doi: 10.3389/fphar.2021.739637. eCollection 2021. Front Pharmacol. 2021. PMID: 34594226 Free PMC article. - The incretin hormone glucagon-like peptide 1 increases mitral cell excitability by decreasing conductance of a voltage-dependent potassium channel.
Thiebaud N, Llewellyn-Smith IJ, Gribble F, Reimann F, Trapp S, Fadool DA. Thiebaud N, et al. J Physiol. 2016 May 15;594(10):2607-28. doi: 10.1113/JP272322. Epub 2016 Apr 13. J Physiol. 2016. PMID: 26931093 Free PMC article. - Hexane Fractions of Bupleurum falcatum L. Stimulates Glucagon-Like Peptide-1 Secretion through G β γ -Mediated Pathway.
Shin MH, Choi EK, Kim KS, Kim KH, Jang YP, Ahn KS, Chung WS, Cha NH, Jang HJ. Shin MH, et al. Evid Based Complement Alternat Med. 2014;2014:982165. doi: 10.1155/2014/982165. Epub 2014 Feb 13. Evid Based Complement Alternat Med. 2014. PMID: 24688594 Free PMC article. - SP6616 as a new Kv2.1 channel inhibitor efficiently promotes β-cell survival involving both PKC/Erk1/2 and CaM/PI3K/Akt signaling pathways.
Zhou TT, Quan LL, Chen LP, Du T, Sun KX, Zhang JC, Yu L, Li Y, Wan P, Chen LL, Jiang BH, Hu LH, Chen J, Shen X. Zhou TT, et al. Cell Death Dis. 2016 May 5;7(5):e2216. doi: 10.1038/cddis.2016.119. Cell Death Dis. 2016. PMID: 27148689 Free PMC article.
References
- McIntosh CHS, Widenmaier S, Kim SJ. Pleiotropic actions of the incretin hormones. Vitam Horm. 2010;84:21–79. - PubMed
- McIntosh CHS, Widenmaier S, Kim SJ. Glucose-dependent insulinotropic polypeptide (gastric inhibitory polypeptide; GIP) Vitam Horm. 2009;80:409–471. - PubMed
- Kim SJ, Winter K, Nian C, Tsuneoka M, Koda Y, McIntosh CHS. Glucose-dependent insulinotropic polypeptide (GIP) stimulation of pancreatic beta-cell survival is dependent upon phosphatidylinositol 3-kinase (PI3 K)/protein kinase B (PKB) signaling, inactivation of the forkhead transcription factor Foxo1, and down-regulation of bax expression. J Biol Chem. 2005;280:22297–22307. - PubMed
- Kim SJ, Nian C, Widenmaier S, McIntosh CHS. Glucose-dependent insulinotropic polypeptide (GIP) mediated up-regulation of β-cell anti-apoptotic Bcl-2 gene expression is coordinated by cAMP-response element binding protein (CREB) and cAMP-responsive CREB coactivator 2 (TORC2) Mol Cell Biol. 2008;28:1644–1656. - PMC - PubMed
Publication types
MeSH terms
Substances
LinkOut - more resources
Full Text Sources
Molecular Biology Databases
Miscellaneous
