Abnormalities of thymic stroma may contribute to immune dysregulation in murine models of leaky severe combined immunodeficiency - PubMed (original) (raw)
Abnormalities of thymic stroma may contribute to immune dysregulation in murine models of leaky severe combined immunodeficiency
Francesca Rucci et al. Front Immunol. 2011.
Erratum in
- Corrigendum: Abnormalities of thymic stroma may contribute to immune dysregulation in murine models of leaky severe combined immunodeficiency.
Rucci F, Poliani PL, Caraffi S, Paganini T, Fontana E, Giliani S, Alt FW, Notarangelo LD. Rucci F, et al. Front Immunol. 2024 Sep 5;15:1467807. doi: 10.3389/fimmu.2024.1467807. eCollection 2024. Front Immunol. 2024. PMID: 39301018 Free PMC article.
Abstract
Lymphostromal cross-talk in the thymus is essential to allow generation of a diversified repertoire of T lymphocytes and to prevent autoimmunity by self-reactive T cells. Hypomorphic mutations in genes that control T cell development have been associated with immunodeficiency and immune dysregulation both in humans and in mice. We have studied T cell development and thymic stroma architecture and maturation in two mouse models of leaky severe combined immune deficiency, carrying hypomorphic mutations in rag1 and lig4 genes. Defective T cell development was associated with abnormalities of thymic architecture that predominantly affect the thymic medulla, with reduction of the pool of mature medullary thymic epithelial cells (mTECs). While the ability of mTECs to express autoimmune regulator (Aire) is preserved in mutant mice, the frequency of mature mTECs expressing Aire and tissue-specific antigens is severely reduced. Similarly, the ability of CD4(+) T cells to differentiate into Foxp3(+) natural regulatory T cells is preserved in rag1 and lig4 mutant mice, but their number is greatly reduced. These data indicate that hypomorphic defects in T cell development may cause defective lymphostromal cross-talk and impinge on thymic stromal cells maturation, and thus favor immune dysregulation.
Conflict of interest statement
The authors declare that the research was conducted in the absence of any commercial or financial relationships that could be construed as a potential conflict of interest.
Figures
Figure 1
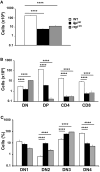
Thymic lymphopenia and impaired T cell development in lig4R/R and rag1S/S mice. (A) Total thymic cellularity from 4 to 5-weeks-old mice shows severe lymphopenia in lig4R/R and rag1S/S mice as compared to WT littermate controls. (B) Thymuses from 4 to 5-weeks-old mice were stained with anti-CD4 and anti-CD8 antibodies and the absolute numbers of live thymocytes at different stages of differentiation are shown in the bar charts (DN, double negative; DP, double positive). (C) Distribution of CD4− CD8− DN thymocytes at various stages of differentiation (DN1–DN4). Mean values ± SE are shown. At least six mice per group were analyzed.
Figure 2
Altered maturation of CD4+ SP medullary thymocytes in the lig4R/R and rag1S/S mice. Upper panels: Representative FACS plots of CD4+ SP medullary thymocytes at various stages of maturation according to the expression of CD69 and Qa2 surface markers. Lower panels: Distribution of the different populations of SP1–SP4 cells. lig4R/R and rag1S/S mice have a significant accumulation of SP4 thymocytes. Mean values ± SE are shown. At least six mice per group were analyzed.
Figure 3
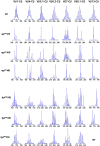
Immunoscope analysis of TCR repertoire in the thymus of rag1S/S and lig4R/R mice. Representative immunoscope profiles of TCRVβ repertoire in the thymus of one WT, three rag1S/S and three lig4R/R mice. Profiles are shown for 7 of the 24 distinct TCR Vβ-Cβ amplification products analyzed. The x axis represents CDR3 length, and arbitrary fluorescence intensity of the run off products is shown on the y axis. ND: not done.
Figure 4
Thymic architecture in wild-type, lig4R/R, and rag1S/S mice. Analysis of thymic architecture and cytokeratin (CK) expression in WT, lig4R/R, and rag1S/S mice. Thymic architecture with identification of cortex (c) and medulla (m) is shown in the first column on the left by hematoxylin and eosin (H&E) staining. The second and third columns show distribution of CK5+ and CK8+ epithelial cells, respectively. Panels in the right column represent dual immunofluorescence (IF) analysis for CK8+ (in red) and CK5+ (in green) cells. Yellow staining identifies cells co-expressing CK5 and CK8. Nuclei are counterstained with DAPI. H&E staining shows normal cortico-medullary demarcation (CMD) in both WT and lig4R/R mutant mice, whereas only focal areas of medullary differentiation (asterisk) are appreciated in rag1S/S mice. A normal distribution of both CK5+ cells, that represent the vast majority of mTECs, and CK8+ cells, that design a fine meshwork of cTECs (upper middle panels, CK5, and CK8 staining), with clear separation between them, is present in WT mice, as shown by IF (upper right panel). Thymuses from lig4R/R mutant mice show CMD with normal distribution of the CK5+ and CK8+ cells, although the CK8+ cTECs show a coarse distribution with a globular morphology (middle panels). A well-defined, but tiny thymic medulla is visualized by IF in lig4R/R mice (right panel). In contrast, thymuses from rag1S/S mice show impaired CMD (H&E, left panel); staining for CKs shows diffuse expression of CK8, and focal expression of CK5 (middle panels). IF shows increased presence of CK5+ CK8+ double positive immature TECs in rag1S/S mice (right panel). All panels are from 20× original magnification. One representative example of 5 mice analyzed per each strain.
Figure 5
Maturation of medullary thymic epithelial cells (mTECs) in wild-type (WT), Lig4 R/R, and Rag1 S/S mice. Mature mTECs from WT mice express claudin-4 (Cld4), Ulex europaeus agglutinin 1 (UEA-1) and Aire (upper panels). Insets highlight fully mature mTECs showing immunoreactivity (IR) for Cld4 and the characteristic granular dot-like Aire positivity in the nuclei. Thymuses from Lig4 R/R mice show residual presence of mTECs that reach full maturation with positivity for UEA-1, Cld4, and Aire expression (middle panels). Loss of corticomedullary demarcation (CMD) with impaired maturation of mTECs was observed in the thymuses from the Rag1 S/S mice in which only rare UEA-1 IR cells but no mature Cld4+ and Aire+ cells were found (lower panels). IR staining: brown. All panels are from 20× original magnification; insets are from 40× original magnification. One representative example of five mice analyzed per each strain.
Figure 6
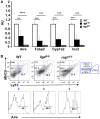
Reduced expression of Aire and of tissue-specific antigens (TSAs) in the thymus of lig4R/R and rag1S/S mice. (A) Reduced expression of Aire and TSAs (fatty acid binding protein, Fabp2; cytochrome p450, Cyp1a2; insulin 2, Ins2) in the thymus of lig4R/R and rag1S/S mice. Real time PCR results were normalized to the pan-epithelial marker EpCAM1. Mean values ± SD are shown. Seven mice per group were analyzed; AU, arbitrary units. (B) Representative example of flow cytometry analysis of cortical and medullary compartments shows that in the thymus of lig4R/R and rag1S/S mice the mature medullary compartment (MHC-IIhi) is poorly represented. The percentage of Aire+ cells among mature mTECs is largely preserved in both mutant mice. At least five mice per group were analyzed.
Figure 7
Altered distribution of thymic DCs populations in lig4R/R and rag1S/S thymuses. Top panels: FACS dot plot analysis of the distribution of CD11c+ CD45RA− cDCs and CD11cint CD45RAhi pDCs in the thymus of WT, lig4R/R, and rag1S/S mice after gating on a population of stromal cells positive for CD11c expression but negative for a cocktail of biotinylated markers specific for markers of T and B lymphocytes, erythroid, granulocyte, and macrophage lineages. Lower panels: Proportion of thymic cDCs and pDCs in WT, lig4R/R, and rag1S/S mice. Mean values ± SE are shown. At least six mice per group were analyzed.
Figure 8
Generation of nTregs in the thymus of lig4R/R and rag1S/S mice. Representative example of flow cytometry analysis of thymocytes stained with anti-CD4, anti-CD8, anti-CD25, and anti-Foxp3 antibodies revealed that generation of nTregs is preserved in the thymus of 4 to 5-weeks-old lig4R/R and rag1S/S mice as compared to what observed in WT age-matched littermates. At least six mice per group were analyzed.
Figure A1
Altered maturation of CD4+ SP medullary thymocytes in the fetal thymus of lig4R/R and rag1S/S mice. Upper panels: Representative FACS plots of CD4+ SP medullary thymocytes at various stages of maturation according to the expression of CD69 and Qa2 surface markers. Lower panels: Distribution of the different populations of SP1–SP4 cells. lig4R/R and rag1S/S mice have a significant accumulation of SP3 thymocytes. Mean values ± SE are shown. At least three to five mice per group were analyzed.
Similar articles
- Rag defects and thymic stroma: lessons from animal models.
Marrella V, Poliani PL, Notarangelo LD, Grassi F, Villa A. Marrella V, et al. Front Immunol. 2014 Jun 2;5:259. doi: 10.3389/fimmu.2014.00259. eCollection 2014. Front Immunol. 2014. PMID: 25076946 Free PMC article. Review. - RANK signals from CD4(+)3(-) inducer cells regulate development of Aire-expressing epithelial cells in the thymic medulla.
Rossi SW, Kim MY, Leibbrandt A, Parnell SM, Jenkinson WE, Glanville SH, McConnell FM, Scott HS, Penninger JM, Jenkinson EJ, Lane PJ, Anderson G. Rossi SW, et al. J Exp Med. 2007 Jun 11;204(6):1267-72. doi: 10.1084/jem.20062497. Epub 2007 May 14. J Exp Med. 2007. PMID: 17502664 Free PMC article. - Combined transient ablation and single-cell RNA-sequencing reveals the development of medullary thymic epithelial cells.
Wells KL, Miller CN, Gschwind AR, Wei W, Phipps JD, Anderson MS, Steinmetz LM. Wells KL, et al. Elife. 2020 Nov 23;9:e60188. doi: 10.7554/eLife.60188. Elife. 2020. PMID: 33226342 Free PMC article. - Aire suppresses CTLA-4 expression from the thymic stroma to control autoimmunity.
Morimoto J, Matsumoto M, Miyazawa R, Yoshida H, Tsuneyama K, Matsumoto M. Morimoto J, et al. Cell Rep. 2022 Feb 15;38(7):110384. doi: 10.1016/j.celrep.2022.110384. Cell Rep. 2022. PMID: 35172142 - Thymus microenvironment in human primary immunodeficiency diseases.
Poliani PL, Vermi W, Facchetti F. Poliani PL, et al. Curr Opin Allergy Clin Immunol. 2009 Dec;9(6):489-95. doi: 10.1097/ACI.0b013e3283327e5c. Curr Opin Allergy Clin Immunol. 2009. PMID: 19841578 Review.
Cited by
- Human thymus medullary epithelial cells promote regulatory T-cell generation by stimulating interleukin-2 production via ICOS ligand.
Nazzal D, Gradolatto A, Truffault F, Bismuth J, Berrih-Aknin S. Nazzal D, et al. Cell Death Dis. 2014 Sep 11;5(9):e1420. doi: 10.1038/cddis.2014.377. Cell Death Dis. 2014. PMID: 25210803 Free PMC article. - Thymic involution perturbs negative selection leading to autoreactive T cells that induce chronic inflammation.
Coder BD, Wang H, Ruan L, Su DM. Coder BD, et al. J Immunol. 2015 Jun 15;194(12):5825-37. doi: 10.4049/jimmunol.1500082. Epub 2015 May 8. J Immunol. 2015. PMID: 25957168 Free PMC article. - The cup runneth over: lessons from the ever-expanding pool of primary immunodeficiency diseases.
Milner JD, Holland SM. Milner JD, et al. Nat Rev Immunol. 2013 Sep;13(9):635-48. doi: 10.1038/nri3493. Epub 2013 Jul 26. Nat Rev Immunol. 2013. PMID: 23887241 Review. - Rag defects and thymic stroma: lessons from animal models.
Marrella V, Poliani PL, Notarangelo LD, Grassi F, Villa A. Marrella V, et al. Front Immunol. 2014 Jun 2;5:259. doi: 10.3389/fimmu.2014.00259. eCollection 2014. Front Immunol. 2014. PMID: 25076946 Free PMC article. Review. - Hypomorphic Rag1 mutations alter the preimmune repertoire at early stages of lymphoid development.
Ott de Bruin LM, Bosticardo M, Barbieri A, Lin SG, Rowe JH, Poliani PL, Ching K, Eriksson D, Landegren N, Kämpe O, Manis JP, Notarangelo LD. Ott de Bruin LM, et al. Blood. 2018 Jul 19;132(3):281-292. doi: 10.1182/blood-2017-12-820985. Epub 2018 May 9. Blood. 2018. PMID: 29743177 Free PMC article.
References
- Akiyama T., Shimo Y., Yanai H., Qin J., Ohshima D., Maruyama Y., Asaumi Y., Kitazawa J., Takayanagi H., Penninger J. M., Matsumoto M., Nitta T., Takahama Y., Inoue J. (2008). The tumor necrosis factor family receptors RANK and CD40 cooperatively establish the thymic medullary microenvironment and self-tolerance. Immunity 29, 423–437.10.1016/j.immuni.2008.06.015 - DOI - PubMed
- Anderson G., Jenkinson E. J. (2001). Lymphostromal interactions in thymic development and function. Nat. Rev. Immunol. 1, 31–40. - PubMed
- Aschenbrenner K., D’Cruz L. M., Vollmann E. H., Hinterberger M., Emmerich J., Swee L. K., Rolink A., Klein L. (2007). Selection of Foxp3+ regulatory T cells specific for self antigen expressed and presented by Aire+ medullary thymic epithelial cells. Nat. Immunol. 8, 351–358. - PubMed
LinkOut - more resources
Full Text Sources
Research Materials


