A multivariate model of ErbB network composition predicts ovarian cancer cell response to canertinib - PubMed (original) (raw)
. 2012 Jan;109(1):213-24.
doi: 10.1002/bit.23297. Epub 2011 Aug 23.
Affiliations
- PMID: 21830205
- PMCID: PMC3786202
- DOI: 10.1002/bit.23297
A multivariate model of ErbB network composition predicts ovarian cancer cell response to canertinib
Rexxi D Prasasya et al. Biotechnol Bioeng. 2012 Jan.
Abstract
Identifying the optimal treatment strategy for cancer is an important challenge, particularly for complex diseases like epithelial ovarian cancer (EOC) that are prone to recurrence. In this study we developed a quantitative, multivariate model to predict the extent of ovarian cancer cell death following treatment with an ErbB inhibitor (canertinib, CI-1033). A partial least squares regression model related the levels of ErbB receptors and ligands at the time of treatment to sensitivity to CI-1033. In this way, the model mimics the clinical problem by incorporating only information that would be available at the time of drug treatment. The full model was able to fit the training set data and was predictive. Model analysis demonstrated the importance of including both ligand and receptor levels in this approach, consistent with reports of the role of ErbB autocrine loops in EOC. A reduced multi-protein model was able to predict CI-1033 sensitivity of six distinct EOC cell lines derived from the three subtypes of EOC, suggesting that quantitatively characterizing the ErbB network could be used to broadly predict EOC response to CI-1033. Ultimately, this systems biology approach examining multiple proteins has the potential to uncover multivariate functions to identify subsets of tumors that are most likely to respond to a targeted therapy.
Copyright © 2011 Wiley Periodicals, Inc.
Figures
Figure 1
(A) Overview of the ErbB network. Arrows indicate the potential autocrine interactions between ligands and receptors. ErbB2 has no known ligand while ErbB3 has minimal kinase activity. (B) Overview of PLSR modeling, where the X matrix composed of receptor and ligand levels is regressed against the Y matrix of CI-1033 sensitivity.
Figure 2
Levels of ErbB1-4 in the serous EOC cell lines panel, relative to concurrently run master lysate. N/D indicates non-detectable level.
Figure 3
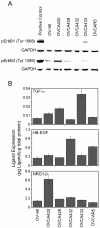
ErbB autocrine loop characterization. (A) Screen of ErbB1 and ErbB3 phosphorylation under serum-starved conditions. pErbB1 positive control is OVCA433 treated with 100 ng/mL of EGF for 10 minutes prior to lysing. pErbB3 positive control is OVCA432 treated with 100 ng/mL of NRG1-β for 10 minutes prior to lysing. (B) Levels of autocrine ErbB ligands in EOC cell lysates.
Figure 4
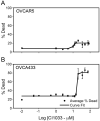
Representative CI-1033 cytotoxicity dose-response curves. (A) OVCAR5, (B) OVCA433.
Figure 5
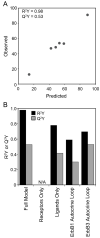
A multi-protein model is needed to predict cell line cytotoxicity to CI-1033. (A) Full PLSR model of CI-1033 cytotoxicity, and (B) reduced CI-1033 cytotoxicity models built using subsets of proteins. N/A indicates inability to build a model using that protein subset.
Figure 6
Expression of ErbB1-4 in EOC cell lines in the prediction set. The grey box represents the data range included in the original full PLSR model of CI-1033 cytotoxicity.
Figure 7
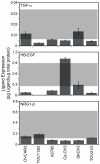
ErbB autocrine ligands in the EOC cell lines in the prediction set. The grey box represents the data range included in the original full PLSR model of CI-1033 cytotoxicity.
Figure 8
Model predictions of additional EOC cell lines. (A) Original full PLSR model, (B) full PLSR model with expanded ErbB2 range, (C) reduced PLSR model excluding ErbB2. Note that due to the inclusion of SKOV-3 in the training set of (B), that model has only 5 members in the prediction set.
Figure 9
Top nine reduced models. (A) Subsets of proteins used in the top nine models, shaded box indicates the protein was included in the X matrix. (B) Representative predictions of a reduced CI-1033 cytotoxicity model (X matrix composed of ErbB1, NRG1-β, and TGFα).
Similar articles
- Dacomitinib, a pan-inhibitor of ErbB receptors, suppresses growth and invasive capacity of chemoresistant ovarian carcinoma cells.
Momeny M, Zarrinrad G, Moghaddaskho F, Poursheikhani A, Sankanian G, Zaghal A, Mirshahvaladi S, Esmaeili F, Eyvani H, Barghi F, Sabourinejad Z, Alishahi Z, Yousefi H, Ghasemi R, Dardaei L, Bashash D, Chahardouli B, Dehpour AR, Tavakkoly-Bazzaz J, Alimoghaddam K, Ghavamzadeh A, Ghaffari SH. Momeny M, et al. Sci Rep. 2017 Jun 23;7(1):4204. doi: 10.1038/s41598-017-04147-0. Sci Rep. 2017. PMID: 28646172 Free PMC article. - Induction of autophagy enhances apoptotic cell death via epidermal growth factor receptor inhibition by canertinib in cervical cancer cells.
Aydinlik S, Dere E, Ulukaya E. Aydinlik S, et al. Biochim Biophys Acta Gen Subj. 2019 May;1863(5):903-916. doi: 10.1016/j.bbagen.2019.02.014. Epub 2019 Feb 27. Biochim Biophys Acta Gen Subj. 2019. PMID: 30825616 - Patient-Derived Xenograft Models of Epithelial Ovarian Cancer for Preclinical Studies.
Heo EJ, Cho YJ, Cho WC, Hong JE, Jeon HK, Oh DY, Choi YL, Song SY, Choi JJ, Bae DS, Lee YY, Choi CH, Kim TJ, Park WY, Kim BG, Lee JW. Heo EJ, et al. Cancer Res Treat. 2017 Oct;49(4):915-926. doi: 10.4143/crt.2016.322. Epub 2017 Jan 4. Cancer Res Treat. 2017. PMID: 28052650 Free PMC article. - Potential benefits of the irreversible pan-erbB inhibitor, CI-1033, in the treatment of breast cancer.
Allen LF, Lenehan PF, Eiseman IA, Elliott WL, Fry DW. Allen LF, et al. Semin Oncol. 2002 Jun;29(3 Suppl 11):11-21. doi: 10.1053/sonc.2002.34049. Semin Oncol. 2002. PMID: 12138393 Review. - The epidermal growth factor receptor as a therapeutic target in epithelial ovarian cancer.
Gui T, Shen K. Gui T, et al. Cancer Epidemiol. 2012 Oct;36(5):490-6. doi: 10.1016/j.canep.2012.06.005. Epub 2012 Jul 20. Cancer Epidemiol. 2012. PMID: 22818908 Review.
Cited by
- Rational Design of HER2-Targeted Combination Therapies to Reverse Drug Resistance in Fibroblast-Protected HER2+ Breast Cancer Cells.
Poskus MD, McDonald J, Laird M, Li R, Norcoss K, Zervantonakis IK. Poskus MD, et al. Cell Mol Bioeng. 2024 Oct 11;17(5):491-506. doi: 10.1007/s12195-024-00823-0. eCollection 2024 Oct. Cell Mol Bioeng. 2024. PMID: 39513002 Free PMC article. - Cellular context alters EGF-induced ERK dynamics and reveals potential crosstalk with GDF-15.
Krause HB, Karls AL, McClean MN, Kreeger PK. Krause HB, et al. Biomicrofluidics. 2022 Oct 7;16(5):054104. doi: 10.1063/5.0114334. eCollection 2022 Sep. Biomicrofluidics. 2022. PMID: 36217350 Free PMC article. - Topological defects in the mesothelium suppress ovarian cancer cell clearance.
Zhang J, Yang N, Kreeger PK, Notbohm J. Zhang J, et al. APL Bioeng. 2021 Aug 3;5(3):036103. doi: 10.1063/5.0047523. eCollection 2021 Sep. APL Bioeng. 2021. PMID: 34396026 Free PMC article. - Ovarian cancer cells direct monocyte differentiation through a non-canonical pathway.
Fogg KC, Miller AE, Li Y, Flanigan W, Walker A, O'Shea A, Kendziorski C, Kreeger PK. Fogg KC, et al. BMC Cancer. 2020 Oct 17;20(1):1008. doi: 10.1186/s12885-020-07513-w. BMC Cancer. 2020. PMID: 33069212 Free PMC article. - Tumor cell sensitivity to vemurafenib can be predicted from protein expression in a BRAF-V600E basket trial setting.
Carroll MJ, Parent CR, Page D, Kreeger PK. Carroll MJ, et al. BMC Cancer. 2019 Oct 31;19(1):1025. doi: 10.1186/s12885-019-6175-2. BMC Cancer. 2019. PMID: 31672130 Free PMC article.
References
- Alper O, Bergmann-Leitner ES, Bennett TA, Hacker NF, Stromberg K, Stetler-Stevenson WG. Epidermal growth factor receptor signaling and the invasive phenotype of ovarian carcinoma cells. J Natl Cancer Inst. 2001;93(18):1375–84. - PubMed
- Bast RC, Jr., Pusztai L, Kerns BJ, MacDonald JA, Jordan P, Daly L, Boyer CM, Mendelsohn J, Berchuck A. Coexpression of the HER-2 gene product, p185HER-2, and epidermal growth factor receptor, p170EGF-R, on epithelial ovarian cancers and normal tissues. Hybridoma. 1998;17(4):313–21. - PubMed
- Campos S, Hamid O, Seiden MV, Oza A, Plante M, Potkul RK, Lenehan PF, Kaldjian EP, Varterasian ML, Jordan C. Multicenter, randomized phase II trial of oral CI-1033 for previously treated advanced ovarian cancer. J Clin Oncol. 2005;23(24):5597–604. others. - PubMed
Publication types
MeSH terms
Substances
LinkOut - more resources
Full Text Sources
Medical
Research Materials
Miscellaneous


