Dynamin inhibition blocks botulinum neurotoxin type A endocytosis in neurons and delays botulism - PubMed (original) (raw)
. 2011 Oct 14;286(41):35966-35976.
doi: 10.1074/jbc.M111.283879. Epub 2011 Aug 5.
Sally Martin 1, Tam H Nguyen 1, Shari J Daniels 1, Nickolas A Lavidis 2, Michel R Popoff 3, Gordana Hadzic 4, Anna Mariana 5, Ngoc Chau 5, Adam McCluskey 4, Phillip J Robinson 5, Frederic A Meunier 6
Affiliations
- PMID: 21832053
- PMCID: PMC3195592
- DOI: 10.1074/jbc.M111.283879
Dynamin inhibition blocks botulinum neurotoxin type A endocytosis in neurons and delays botulism
Callista B Harper et al. J Biol Chem. 2011.
Abstract
The botulinum neurotoxins (BoNTs) are di-chain bacterial proteins responsible for the paralytic disease botulism. Following binding to the plasma membrane of cholinergic motor nerve terminals, BoNTs are internalized into an endocytic compartment. Although several endocytic pathways have been characterized in neurons, the molecular mechanism underpinning the uptake of BoNTs at the presynaptic nerve terminal is still unclear. Here, a recombinant BoNT/A heavy chain binding domain (Hc) was used to unravel the internalization pathway by fluorescence and electron microscopy. BoNT/A-Hc initially enters cultured hippocampal neurons in an activity-dependent manner into synaptic vesicles and clathrin-coated vesicles before also entering endosomal structures and multivesicular bodies. We found that inhibiting dynamin with the novel potent Dynasore analog, Dyngo-4a(TM), was sufficient to abolish BoNT/A-Hc internalization and BoNT/A-induced SNAP25 cleavage in hippocampal neurons. Dyngo-4a also interfered with BoNT/A-Hc internalization into motor nerve terminals. Furthermore, Dyngo-4a afforded protection against BoNT/A-induced paralysis at the rat hemidiaphragm. A significant delay of >30% in the onset of botulism was observed in mice injected with Dyngo-4a. Dynamin inhibition therefore provides a therapeutic avenue for the treatment of botulism and other diseases caused by pathogens sharing dynamin-dependent uptake mechanisms.
Figures
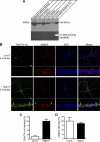
FIGURE 1.
The uptake of Alexa Fluor 488-BoNT/A-Hc in cultured hippocampal neurons is activity-dependent. A, Western blot of BoNT/A-Hc. Recombinant BoNT/A-Hc was expressed and purified on Co2+-IDA agarose before conjugation to Alexa Fluor 488 C5 maleimide. The fractions (of equivalent volume, 6 μl) indicated on the figure were run on an SDS-PAGE, and Western blotting using a His6 antibody was carried out to confirm the presence of the protein. The PVDF membrane was exposed to UV light to check the conjugation of the protein. B, cultured hippocampal neurons incubated for 5 min with Alexa Fluor 488-BoNT/A-Hc (100 n
m
) in the absence or presence of high K+. Neurons were then fixed and processed for βIII-tubulin (BIIIT) and VAMP2 immunolabeling. A representative confocal micrograph shows a clear lack of Alexa Fluor 488-BoNT/A-Hc uptake in the absence of high K+. Uptake of Alexa Fluor 488-BoNT/A-Hc is increased significantly in the presence of high K+ and shows a partial co-localization with VAMP2 (arrow). The arrowhead indicates an Alexa Fluor 488-BoNT/A-Hc-positive compartment that does not co-localize with VAMP2. Scale bars, 10 μm. C, level of Alexa Fluor 488-BoNT/A-Hc uptake in neuritic processes determined as described under “Experimental Procedures.” A t test revealed a significant increase (**, p < 0.01) in fluorescence intensity upon stimulation with high K+ (n = 30–38 regions of interest), two independent experiments). D, intensity of VAMP2 immunostaining determined as an internal control to ensure there was no change between tested samples (n = 30–38, two independent experiments).
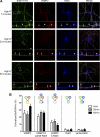
FIGURE 2.
Internalized Alexa Fluor 488-BoNT/A-Hc shows partial co-localization with Rab5 and VAMP2. Cultured hippocampal neurons were incubated for 5 min in the presence of high K+ with Alexa Fluor 488-BoNT/A-Hc (100 n
m
), after which they were washed and incubated in low K+ buffer for a further 25 or 55 min. The cells were then fixed and processed for immunocytochemistry using VAMP2 and Rab5 antibodies. A, representative confocal micrographs show a good degree of co-localization between Alexa Fluor 488-BoNT/A-Hc and VAMP2. In several instances, these compartments showed at least partial co-localization with Rab5 staining (arrows). Few Alexa Fluor 488-BoNT/A-Hc-positive structures did not co-localize with either Rab5 or VAMP2 (arrowheads). Scale bars, 10 μm. B, the level of co-localization was quantified by determining the number of Alexa Fluor 488-BoNT/A-Hc-positive compartments that showed co-localization in selected regions of interest in neurites. Alexa Fluor 488-BoNT/A-Hc co-localized mainly with VAMP2. Some of these Alexa Fluor 488-BoNT/A-Hc/VAMP2-positive compartments also showed an either full or partial co-localization with Rab5. Alexa Fluor 488-BoNT/A-Hc rarely co-localized with Rab5 alone (n = 12–17, two or three independent experiments).
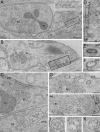
FIGURE 3.
BoNT/A-Hc endocytosis into synaptic vesicles, clathrin-coated vesicles, endosomes, and MVBs. Hippocampal neurons were incubated with BoNT/A-Hc-gold, after which they were fixed and processed for electron microscopy. The distribution of BoNT/A-Hc-gold in cultured hippocampal neurons was analyzed in unstimulated cells (A and inset), following a 5-min stimulation (B–E), or following a 5-min stimulation and a 25-min chase period (F–K). Note that D is an enlargement of the boxed area in B. m, mitochondria; sv, synaptic vesicles; pm, plasma membrane; e, endosomes; ccv, clathrin-coated vesicles; ccp, clathrin-coated pit; mvb, multivesicular body. Scale bars, 200 nm (A) and 100 nm (B–K).
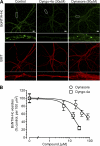
FIGURE 4.
Dynamin inhibition blocks Alexa Fluor 488-BoNT/A-Hc uptake in cultured hippocampal neurons. A, cultured hippocampal neurons were pretreated with increasing concentrations of Dyngo-4a or Dynasore in high K+ buffer for 20 min before the addition of Alexa Fluor 488-BoNT/A-Hc (100 n
m
) for a further 5 min. Cells were then fixed and processed for immunocytochemistry with βIII-tubulin (BIIIT) antibody, which was used to confirm the neuronal nature of the cells. A representative confocal micrograph shows that treatment with both Dyngo-4a and Dynasore, at the indicated concentrations, substantially reduced the uptake of Alexa Fluor 488-BoNT/A-Hc. Scale bars, 10 μm. B, the inhibition of Alexa Fluor 488-BoNT/A-Hc by the two inhibitors was quantified by determining the number of Alexa Fluor 488-BoNT/A-Hc-positive vesicles/100 μm2 in the region of interest in the cell body and neurites. The data were transformed to x = log(x) and fitted to a nonlinear curve to determine the IC50 (16.0 ± 1.2 μ
m
for Dyngo-4a and 79.3 ± 1.3 μ
m
for Dynasore). A one-way ANOVA with Bonferroni's post test confirmed that treatment with 15 and 30 μ
m
Dyngo-4a or 40 and 80 μ
m
Dynasore significantly reduced the uptake of Alexa Fluor 488-BoNT/A-Hc (**, p < 0.01, n = 45–60, two or three independent experiments).
FIGURE 5.
A, Alexa Fluor 488-BoNT/A-Hc (800 n
m
) and Alexa Fluor 555-α-bungarotoxin (α-BTx, 1 μ
m
) were added to amphibian neuromuscular junction preparations with or without Dyngo-4a (30 μ
m
) in high K+ frog Ringer's solution for 20 min on ice. Preparations were washed with room temperature normal frog Ringer's solution five times and left in the final wash in the presence or absence of Dyngo-4a. Nerve terminals were visualized with α-bungarotoxin and imaged by confocal microscopy. Representative micrographs are shown. Scale bars, 5 μm. B and C, fluorescence recovery after photobleaching experiments were carried out following a series of 10 images by 20 iterations (100% argon (488 nm) laser power) on identified regions of interest. The recovery was recorded continuously for 1 min thereafter (n = 3 terminals per condition). B, representative kymographs are also shown. C, the recovery of fluorescence intensity immediately after bleaching was graphed. The data were fitted to a one-phase association curve (y = Plateau*(1 − exp (−K*x))), and the mobile and immobile fractions for each condition were determined.
FIGURE 6.
Dyngo-4a prevents SNAP25 cleavage by BoNT/A in cultured hippocampal neurons. Primary hippocampal neurons were pretreated with Dyngo-4a (30 μ
m
) or DMSO in low K+ buffer for 20 min before changing the solution to high K+ buffer containing Dyngo-4a or DMSO in the presence or absence of BoNT/A (100 p
m
) for 5 min. The cells were washed five times with low K+ buffer in the continuing presence of Dyngo-4a, incubated for a further 90 min, then transferred to a dish containing an astroglial support culture and conditioned medium for 24 h. A, the neurons were processed for Western blotting using an antibody raised against BoNT/A-truncated SNAP25 (37, 38). B, the amount of cleaved SNAP25 present in the BoNT/A-treated samples was normalized against β-actin to determine the percentage decrease in the Dyngo-4a-treated samples. A paired t test showed a significant reduction in the level of cleaved SNAP25 following treatment with Dyngo-4a (**, p < 0.01, (n = 3).
FIGURE 7.
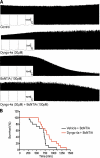
Dyngo-4a provides protection again BoNT/A-induced paralysis in the phrenic nerve-hemidiaphragm twitch model and in vivo. A, rat phrenic nerve-hemidiaphragm preparations were stimulated with square pulses of 0.1 ms, 0.2 Hz, 10 V over 6–8 h. Muscles were treated as indicated with Dyngo-4a added 1 h prior to the addition of BoNT/A (n = 3–9). The contractile force was measured using a force transducer and recorded through Chart software. Representative traces are shown. B, female CD-1 mice (30–40 g) were injected intraperitoneally with Dyngo-4a (1 mg) or vehicle. 1.5–2 h following this injection they were challenged with BoNT/A (2 LD50) injected via the tail vein. A second injection of Dyngo-4a was administered after the first. Several mice were also injected with Dyngo-4a alone or vehicle to ensure that no adverse reactions were produced by these compounds. Mice were monitored for obvious signs of botulism and euthanized when exhibiting clear signs of breathing difficulties. This time was recorded and graphed in a survival time line. A Mantel-Cox test showed that the two curves were significantly different (n = 10, *, p < 0.05).
Similar articles
- Building a better dynasore: the dyngo compounds potently inhibit dynamin and endocytosis.
McCluskey A, Daniel JA, Hadzic G, Chau N, Clayton EL, Mariana A, Whiting A, Gorgani NN, Lloyd J, Quan A, Moshkanbaryans L, Krishnan S, Perera S, Chircop M, von Kleist L, McGeachie AB, Howes MT, Parton RG, Campbell M, Sakoff JA, Wang X, Sun JY, Robertson MJ, Deane FM, Nguyen TH, Meunier FA, Cousin MA, Robinson PJ. McCluskey A, et al. Traffic. 2013 Dec;14(12):1272-89. doi: 10.1111/tra.12119. Epub 2013 Oct 9. Traffic. 2013. PMID: 24025110 Free PMC article. - Toward the discovery of dual inhibitors for botulinum neurotoxin A: concomitant targeting of endocytosis and light chain protease activity.
Seki H, Xue S, Hixon MS, Pellett S, Remes M, Johnson EA, Janda KD. Seki H, et al. Chem Commun (Camb). 2015 Apr 11;51(28):6226-9. doi: 10.1039/c5cc00677e. Chem Commun (Camb). 2015. PMID: 25759983 - Control of autophagosome axonal retrograde flux by presynaptic activity unveiled using botulinum neurotoxin type a.
Wang T, Martin S, Papadopulos A, Harper CB, Mavlyutov TA, Niranjan D, Glass NR, Cooper-White JJ, Sibarita JB, Choquet D, Davletov B, Meunier FA. Wang T, et al. J Neurosci. 2015 Apr 15;35(15):6179-94. doi: 10.1523/JNEUROSCI.3757-14.2015. J Neurosci. 2015. PMID: 25878289 Free PMC article. - Special Delivery: Potential Mechanisms of Botulinum Neurotoxin Uptake and Trafficking within Motor Nerve Terminals.
Winner BM, Bodt SML, McNutt PM. Winner BM, et al. Int J Mol Sci. 2020 Nov 18;21(22):8715. doi: 10.3390/ijms21228715. Int J Mol Sci. 2020. PMID: 33218099 Free PMC article. Review. - Targeting membrane trafficking in infection prophylaxis: dynamin inhibitors.
Harper CB, Popoff MR, McCluskey A, Robinson PJ, Meunier FA. Harper CB, et al. Trends Cell Biol. 2013 Feb;23(2):90-101. doi: 10.1016/j.tcb.2012.10.007. Epub 2012 Nov 17. Trends Cell Biol. 2013. PMID: 23164733 Review.
Cited by
- Small molecules demonstrate the role of dynamin as a bi-directional regulator of the exocytosis fusion pore and vesicle release.
Jackson J, Papadopulos A, Meunier FA, McCluskey A, Robinson PJ, Keating DJ. Jackson J, et al. Mol Psychiatry. 2015 Jul;20(7):810-9. doi: 10.1038/mp.2015.56. Epub 2015 May 5. Mol Psychiatry. 2015. PMID: 25939402 - Membrane protrusion powers clathrin-independent endocytosis of interleukin-2 receptor.
Basquin C, Trichet M, Vihinen H, Malardé V, Lagache T, Ripoll L, Jokitalo E, Olivo-Marin JC, Gautreau A, Sauvonnet N. Basquin C, et al. EMBO J. 2015 Aug 13;34(16):2147-61. doi: 10.15252/embj.201490788. Epub 2015 Jun 29. EMBO J. 2015. PMID: 26124312 Free PMC article. - Phosphatidylserine dynamics in cellular membranes.
Kay JG, Koivusalo M, Ma X, Wohland T, Grinstein S. Kay JG, et al. Mol Biol Cell. 2012 Jun;23(11):2198-212. doi: 10.1091/mbc.E11-11-0936. Epub 2012 Apr 11. Mol Biol Cell. 2012. PMID: 22496416 Free PMC article. - Rapid synaptic vesicle endocytosis in cone photoreceptors of salamander retina.
Van Hook MJ, Thoreson WB. Van Hook MJ, et al. J Neurosci. 2012 Dec 12;32(50):18112-23. doi: 10.1523/JNEUROSCI.1764-12.2012. J Neurosci. 2012. PMID: 23238726 Free PMC article. - Preferential entry of botulinum neurotoxin A Hc domain through intestinal crypt cells and targeting to cholinergic neurons of the mouse intestine.
Couesnon A, Molgó J, Connan C, Popoff MR. Couesnon A, et al. PLoS Pathog. 2012;8(3):e1002583. doi: 10.1371/journal.ppat.1002583. Epub 2012 Mar 15. PLoS Pathog. 2012. PMID: 22438808 Free PMC article.
References
- Meunier F. A., Colasante C., Molgo J. (1997) Neuroscience 78, 883–893 - PubMed
- Meunier F. A., Mattei C., Chameau P., Lawrence G., Colasante C., Kreger A. S., Dolly J. O., Molgó J. (2000) J. Cell Sci. 113, 1119–1125 - PubMed
- Arnon S. S., Schechter R., Inglesby T. V., Henderson D. A., Bartlett J. G., Ascher M. S., Eitzen E., Fine A. D., Hauer J., Layton M., Lillibridge S., Osterholm M. T., O'Toole T., Parker G., Perl T. M., Russell P. K., Swerdlow D. L., Tonat K. (2001) JAMA 285, 1059–1070 - PubMed
- Osborne S. L., Latham C. F., Wen P. J., Cavaignac S., Fanning J., Foran P. G., Meunier F. A. (2007) J. Neurosci. Res. 85, 1149–1158 - PubMed
Publication types
MeSH terms
Substances
LinkOut - more resources
Full Text Sources
Other Literature Sources
Medical
