Caveolin-2 is a negative regulator of anti-proliferative function and signaling of transforming growth factor-β in endothelial cells - PubMed (original) (raw)
Caveolin-2 is a negative regulator of anti-proliferative function and signaling of transforming growth factor-β in endothelial cells
Leike Xie et al. Am J Physiol Cell Physiol. 2011 Nov.
Abstract
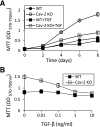
Using a combination of wild-type (WT) and caveolin-2 (Cav-2) knockout along with retroviral reexpression approaches, we provide the evidence for the negative role of Cav-2 in regulating anti-proliferative function and signaling of transforming growth factor β (TGF-β) in endothelial cells (ECs). Although, TGF-β had a modest inhibitory effect on WT ECs, it profoundly inhibited proliferation of Cav-2 knockout ECs. To confirm the specificity of the observed difference in response to TGF-β, we have stably reexpressed Cav-2 in Cav-2 knockout ECs using a retroviral approach. Similar to WT ECs, the anti-proliferative effect of TGF-β was dramatically reduced in the Cav-2 reexpressing ECs. The reduced anti-proliferative effect of TGF-β in Cav-2-positive cells was evidenced by three independent proliferation assays: 3-(4,5-dimethylthiazol-2-yl)-2,5-diphenyltetrazolium bromide (MTT), cell count, and bromodeoxyuridine incorporation and correlated with a loss of TGF-β-mediated upregulation of cell cycle inhibitor p27 and subsequent reduction of the levels of hyperphosphorylated (inactive) form of the retinoblastoma protein in Cav-2 reexpressing ECs. Mechanistically, Cav-2 inhibits anti-proliferative action of TGF-β by suppressing Alk5-Smad2/3 pathway manifested by reduced magnitude and length of TGF-β-induced Smad2/3 phosphorylation as well as activation of activin receptor-like kinase-5 (Alk5)-Smad2/3 target genes plasminogen activator inhibitor-1 and collagen type I in Cav-2-positive ECs. Expression of Cav-2 does not appear to significantly change targeting of TGF-β receptors I and Smad2/3 to caveolar and lipid raft microdomains as determined by sucrose fractionation gradient. Overall, the negative regulation of TGF-β signaling and function by Cav-2 is independent of Cav-1 expression levels and is not because of changing targeting of Cav-1 protein to plasma membrane lipid raft/caveolar domains.
Figures
Fig. 1.
Increased susceptibility of caveolin-2 (Cav-2) knockout (KO) mouse lung endothelial cells (MLECs) to transforming growth factor-β (TGF-β)-induced inhibition of cell proliferation. Wild-type (WT) and Cav-2 KO MLECs were plated at 4 × 10³ cells per well of 24-well plate and incubated without or with TGF-β. At indicated time points, cells were processed for 3-(4,5-dimethylthiazol-2-yl)-2,5-diphenyltetrazolium bromide (MTT) proliferation assay and optical density (OD) was measured using a plate reader with a test wavelength of 570 nm and a reference wavelength of 750 nm (570–750 nm) to obtain a sample signal and expressed as means ± SD of replicate samples (n = 3). Values are from one representative out of a total 4 experiments. A: time-dependent effect of TGF-β (1 ng/ml) on MLEC proliferation up to 8 days. B: concentration-dependent effect of TGF-β (0.01–10 ng/ml) on MLECs proliferation determined after 6 days of treatment.
Fig. 2.
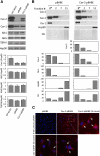
Reexpression of human Cav-2 in Cav-2 KO MLECs. Cav-2 KO MLECs were serially infected (total of 3 rounds) with retrovirus expressing an empty vector pBABE-puro (pBABE) or pBABE plus human Cav-2 (Cav-2-pBABE), followed by selection in the presence of puromycin as described in
materials and methods
. A: WT MLECs and Cav-2 KO MLECs expressing pBABE or Cav-2-pBABE using retroviral approach were lysed and immunoblotted with indicated antibodies. Graphs, densitometric ratios of Cav-1 and indicated TGF-β receptors (TβRs) to heat shock protein 90 (Hsp90) assessed using ImageJ as described in
materials and methods
. Note that low expression level of retrovirally delivered human Cav-2 compared with mouse Cav-2 expressed in WT MLECs (top immunoblot; lane 3 vs. lane 1 and top graph) is insufficient to increase the expression levels of endogenous Cav-1, which is considerably lower in pBABE and Cav-2-pBABE compared with WT MLECs (2nd immunoblot and top graph). B: pBABE and Cav-2-pBABE cells were lysed with TX-100, and lysates were subjected to sucrose floatation gradient as described in
materials and methods
, followed by immunoblotting of selected fractions with indicated antibodies to Cav-2, Cav-1, and Flo-1 (caveolar/lipid raft marker) as well as Hsp90 (cytosolic and heavy membrane marker). CB, Coomassie Blue staining of the above immunoblotted fractions for comparison of protein loading (the picture was compressed by threefold in the vertical dimension). Note that retrovirally expressed human Cav-2 cofractionates with Cav-1 and Flo-1 in caveolar/lipid raft fraction 2. Also, note that endogenous Cav-1 cofractionates with Flo-1 but not with Hsp90 in both pBABE and Cav-2-pBABE cells. 2*, concentrated fraction 2. Graphs, relative (%) distribution of densitometric signal values between selected fractions. C, top: immunofluorescence costaining with rabbit polyclonal antibody against phospho-serine 23-Cav-2 (P-Ser 23-Cav-2) and nuclear staining with DAPI (blue). Note, P-Ser 23-Cav-2-positive staining in Cav-2-pBABE (top middle and right) and lack of the respective staining in pBABE cells (top left). Also, note that retrovirally expressed P-Ser 23-Cav-2 is primarily localized in plasma membrane (arrows) (top right panel with 4× zoom). All microscopic images were captured using objective with ×20 magnification and a selected field depicted by a square in top middle panel was zoomed by 4× and shown in top right panel to visualize more detailed subcellular localization. C, bottom: immunofluorescence costaining with rabbit polyclonal antibody against Cav-1 and nuclear staining with DAPI (blue). Note that Cav-1 is primarily localized to plasma membrane (depicted by arrows) in both pBABE and Cav-2-pBABE cells (Fig. 2_C_; bottom left vs. right). Both images were captured using objective with ×20 magnification and further zoomed by 4× relative to respective top left and middle panels to show more detailed subcellular localization of Cav-1 similar to P-Ser 23-Cav-2 (shown in 2_C_, top right).
Fig. 3.
Reduced susceptibility of MLECs reexpressing Cav-2 to the time and concentration-dependent anti-proliferative effect of TGF-β. A and B: pBABE and Cav-2-pBABE MLECs were plated at 4 × 10³ cells per well of 24-well plate and incubated without or with TGF-β, followed by processing for MTT proliferation assay. OD was measured using a plate reader with a test wavelength of 570 nm and a reference wavelength of 750 nm (570–750 nm) to obtain a sample signal and expressed as means ± SD of replicate samples (n = 3). Values are from one representative out of a total four experiments. A: time-dependent effect of TGF-β (1 ng/ml) on MLEC proliferation up to 6 days. B: concentration-dependent effect of TGF-β (0.001–10 ng/ml) on MLECs proliferation determined after 5 days of treatment. C and D: pBABE and Cav-2-pBABE MLECs were plated at 105 cells per 100-mm dish, cell numbers were determined at the indicated time points using Cell Countess. Values are from one representative out of a total four experiments. C: time-dependent effect of TGF-β (1 ng/ml) on MLEC proliferation up to 8 days. D: concentration-dependent effect of TGF-β (0.001–1 ng/ml) on MLECs proliferation determined after 5 days of treatment.
Fig. 4.
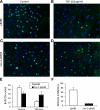
Reduced sensitivity of Cav-2 reexpressing MLECs to TGF-β-mediated inhibition of bromodeoxyuridine (BrdU) incorporation. pBABE or Cav-2-pBABE MLECs were plated at 5 × 10³ per chamber of an 8-chamber glass slide precoated with 0.2% gelatin. One day later, cells were left untreated (A and C, for pBABE and Cav-2-pBABE cells, respectively) or treated with 1 ng/ml of TGF-β (B and D) for 4 days, followed by pulsing with BrdU for 2 h, fixing, and immunofluorescence staining with fluorescein isothiocyanate-conjugated anti-BrdU antibody (green) and DAPI (blue). Note the dramatic decreases in frequency of BrdU-positive (green) cells in pBABE treated with TGF-β (B) vs. control cell (A), while lack of an obvious inhibition in Cav-2-pBABE cells (C vs. D). E: percent BrdU-positive cells was calculated and expressed as means ± SD from independent microscopic fields (n = 9). Values are from one representative out of a total three experiments. F: percent inhibition by TGF-β = (100% − % nuclei in TGF-β-treated samples)/% nuclei in respective nontreated (Control) samples × 100%.
Fig. 5.
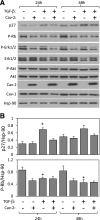
Effect of TGF-β on the expression or phosphorylation levels of selected inhibitors and activators of cell proliferation in Cav-2-negative and -positive MLECs. pBABE and Cav-2-pBABE MLECs were plated at low density (3 × 10⁵ per 150-mm dish), followed by incubation with complete medium without or with TGF-β (1 ng/ml) for 24 and 48 h. At indicated time points, cells were lysed and SDS-PAGE resolved protein lysates immunoblotted with the indicated antibodies to p27, phosporylated Rb protein (P-Rb), phosphorylated ERK1/2 (P-ERK 1/2), total ERK 1/2, phosphorylated Akt (P-Akt), total Akt, caveolins, and Hsp-90. Note that both 24 and 48 h treatment with TGF-β results in a greater increase in the expression levels of p27 in pBABE relative to Cav-2-pBABE cells (top panel and top graph). Also, note that 48 h treatment with TGF-β visibly reduces the P-Rb levels in pBABE but not Cav-2-pBABE (2nd immunoblot from the top and bottom graph). Finally, note that TGF-β does not affect P-ERK 1/2 nor P-Akt levels. B: densitometric ratios of p27 and P-Rb to Hsp90 quantified using Image J, which were selectively affected by TGF-β treatment in pBABE relative to Cav-2-pBABE cells and expressed as means ± SD (n = 3). *P < 0.05 vs. respective control sample; #P < 0.05 vs. respective TGF-β-treated sample at given time point.
Fig. 6.
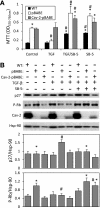
Alk5 dependence of the anti-proliferative effect of TGF-β in MLECs. A: WT MLECs and Cav-2 KO MLECs expressing pBABE or Cav-2-pBABE were plated at 4 × 10³ cells per well of 24-well plate and incubated without or with TGF-β (1 ng/ml and/or SB-5 (1 μM) for 6 days, followed by processing for MTT proliferation assay and measurement of OD as described in
materials and methods
. The data are expressed as means ± SD of replicate samples (n = 3). *P < 0.05 vs. respective TGF-β-treated sample; #P < 0.05 vs. respective control sample. B: WT MLECs and Cav-2 KO MLECs expressing pBABE or Cav-2-pBABE were plated at 3 × 10⁵ per 150-mm dish and incubated without or with TGF-β (1 ng/ml) and/or SB-5 (1 μM) for 24 h, followed by lyses and immunoblotting with the indicated antibodies. Graphs, densitometric ratios of p27 (top) and P-Rb (bottom) to Hsp90 quantified using Image J and expressed as means ± SD (n = 3). *P < 0.05 vs. respective TGF-β-treated sample; #P < 0.05 vs. respective control sample.
Fig. 7.
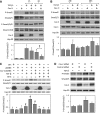
Effect of TGF-β on Smad phosphorylation in Cav-2-negative and -positive MLECs and human umbilical vein endothelial cells (HUVECs) with small interfering RNA (siRNA)-induced knockdown of Cav-2. A and B: pBABE and Cav-2-pBABE MLECs were plated at low density (3 × 10⁵ per 150-mm dish), followed by incubation with complete medium without or with TGF-β (1 ng/ml) for up to 48 h. At indicated time points, cells were lysed and SDS-PAGE resolved protein lysates immunoblotted with the indicated antibodies to phosphorylated Smad2 (P-Smad2), total Smad2, phosphorylated Smad1/5/8 (P-Smad1/5/8), total Smad1/5/8, Cav-2, Cav-1, and Hsp-90. Graphs, densitometric ratios of P-Smad2/Smad2/3 from control and treated with TGF-β for 1 and 6 h (A) or for 24 and 48 h (B) samples quantified based on the above immunoblots and expressed as means ± SD (n = 3). *P < 0.05 vs. respective control sample; #P < 0.05 for vs. respective TGF-β-treated sample at given time point. C: WT MLECs and Cav-2 KO MLECs expressing pBABE or Cav-2-pBABE were plated at 3 × 10⁵ per 150-mm dish and incubated without or with TGF-β (1 ng/ml) and/or SB-5 (1 μM) for 6 h, followed by lyses and immunoblotting with the indicated antibodies. Graph in the bottom represents densitometric ratios of P-Smad2/Smad2/3 quantified based on the above immunoblots and expressed as means ± SD (n = 3). *P < 0.05 vs. respective TGF-β-treated sample; #P < 0.05 vs. respective control sample. D: HUVEC transfected with Cav-2 and control siRNA were treated without or with TGF-β (5 ng/ml) for 3 h, followed by lyses and immunoblotting with indicated antibodies. Graph in the bottom represents densitometric ratios of P-Smad3/Smad2/3 quantified based on the above immunoblots and expressed as means ± SD (n = 3). *P < 0.05 vs. respective control sample.
Fig. 8.
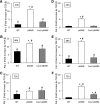
Effect of TGF-β on activin receptor-like kinase-5 (Alk5)-Smad2/3 target gene plasminogen activator inhibitor-1 (PAI-1), and collagen type-1 (Col-1) expression in Cav-2-negative and -positive MLECs. WT MLECs and Cav-2 KO MLECs expressing pBABE or Cav-2-pBABE were plated at low density (3 × 10⁵ per 150-mm dish), followed by incubation with complete medium without or with TGF-β (1 ng/ml) for up to 72 h. At indicated time points, total RNA was isolated and real-time PCR performed as described in
materials and methods
. Data are expressed as fold induction by TGF-β calculated based on the relative amount of target mRNA normalized to the endogenous reference GAPDH mRNA and represented as means ± SD of 3 replications done in duplicates. *P < 0.05 vs. respective WT sample; #P < 0.05 vs. respective control (minus TGF-β) sample at given time point.
Fig. 9.
Detergent-free sucrose fractionation of TGF-β receptors and Smad2/3 in Cav-2-negative and -positive MLECs. WT and Cav-2 KO MLECs cells were lysed with sodium carbonate (pH 11) and sonicated, followed by a sucrose floatation gradient as described in
materials and methods
. Equal amounts of protein were loaded for pooled and concentrated top 3 light (L) fractions, bottom pooled 3 heavy (H) fractions and compared with total (T) cell lysates. A: immunoblotting with indicated antibodies and staining with Coomassie blue (CB) (compressed by 3-fold in the vertical dimension). B–H: relative (%) distribution of densitometric signal values expressed as means ± SD (n = 3) for given proteins normalized against CB between L and H.
Similar articles
- N-terminal tyrosine phosphorylation of caveolin-2 negates anti-proliferative effect of transforming growth factor beta in endothelial cells.
Abel B, Willoughby C, Jang S, Cooper L, Xie L, Vo-Ransdell C, Sowa G. Abel B, et al. FEBS Lett. 2012 Sep 21;586(19):3317-23. doi: 10.1016/j.febslet.2012.07.008. Epub 2012 Jul 20. FEBS Lett. 2012. PMID: 22819829 Free PMC article. - Impairment of transforming growth factor beta signaling in caveolin-1-deficient hepatocytes: role in liver regeneration.
Mayoral R, Valverde ÁM, Llorente Izquierdo C, González-Rodríguez Á, Boscá L, Martín-Sanz P. Mayoral R, et al. J Biol Chem. 2010 Feb 5;285(6):3633-3642. doi: 10.1074/jbc.M109.072900. Epub 2009 Dec 5. J Biol Chem. 2010. PMID: 19966340 Free PMC article. - Endothelial cells isolated from caveolin-2 knockout mice display higher proliferation rate and cell cycle progression relative to their wild-type counterparts.
Xie L, Frank PG, Lisanti MP, Sowa G. Xie L, et al. Am J Physiol Cell Physiol. 2010 Mar;298(3):C693-701. doi: 10.1152/ajpcell.00401.2009. Epub 2009 Dec 9. Am J Physiol Cell Physiol. 2010. PMID: 20007452 Free PMC article. - Clinical development of galunisertib (LY2157299 monohydrate), a small molecule inhibitor of transforming growth factor-beta signaling pathway.
Herbertz S, Sawyer JS, Stauber AJ, Gueorguieva I, Driscoll KE, Estrem ST, Cleverly AL, Desaiah D, Guba SC, Benhadji KA, Slapak CA, Lahn MM. Herbertz S, et al. Drug Des Devel Ther. 2015 Aug 10;9:4479-99. doi: 10.2147/DDDT.S86621. eCollection 2015. Drug Des Devel Ther. 2015. PMID: 26309397 Free PMC article. Review. - Bone marrow Schwann cells induce hematopoietic stem cell hibernation.
Yamazaki S, Nakauchi H. Yamazaki S, et al. Int J Hematol. 2014 Jun;99(6):695-8. doi: 10.1007/s12185-014-1588-9. Epub 2014 May 10. Int J Hematol. 2014. PMID: 24817152 Review.
Cited by
- Regulation of Cell Signaling and Function by Endothelial Caveolins: Implications in Disease.
Sowa G. Sowa G. Transl Med (Sunnyvale). 2012;Suppl 8:001. doi: 10.4172/2161-1025.S8-001. Epub 2012 Jan 4. Transl Med (Sunnyvale). 2012. PMID: 26605130 Free PMC article. - Role of Caveolin Proteins in Sepsis.
Sowa G. Sowa G. Pediatr Ther. 2012;2012(Suppl 2):001. doi: 10.4172/2161-0665.S2-001. Epub 2012 Jan 12. Pediatr Ther. 2012. PMID: 26618071 Free PMC article. - Elevated postischemic tissue injury and leukocyte-endothelial adhesive interactions in mice with global deficiency in caveolin-2: role of PAI-1.
Liu Y, Wang M, Wang D, Fay WP, Korthuis RJ, Sowa G. Liu Y, et al. Am J Physiol Heart Circ Physiol. 2021 Mar 1;320(3):H1185-H1198. doi: 10.1152/ajpheart.00682.2020. Epub 2021 Jan 8. Am J Physiol Heart Circ Physiol. 2021. PMID: 33416452 Free PMC article. - Novel insights into the role of caveolin-2 in cell- and tissue-specific signaling and function.
Sowa G. Sowa G. Biochem Res Int. 2011;2011:809259. doi: 10.1155/2011/809259. Epub 2011 Dec 20. Biochem Res Int. 2011. PMID: 22229094 Free PMC article. - Expression-associated polymorphisms of CAV1-CAV2 affect intraocular pressure and high-tension glaucoma risk.
Kim S, Kim K, Heo DW, Kim JS, Park CK, Kim CS, Kang C. Kim S, et al. Mol Vis. 2015 May 11;21:548-54. eCollection 2015. Mol Vis. 2015. PMID: 26015768 Free PMC article.
References
- Aprelikova O, Xiong Y, Liu ET. Both p16 and p21 families of cyclin-dependent kinase (CDK) inhibitors block the phosphorylation of cyclin-dependent kinases by the CDK-activating kinase. J Biol Chem 270: 18195–18197, 1995 - PubMed
- Bohnsack BL, Hirschi KK. Red light, green light: signals that control endothelial cell proliferation during embryonic vascular development. Cell Cycle 3: 1506–1511, 2004 - PubMed
- Byfield SD, Roberts AB. Lateral signaling enhances TGF-β response complexity. Trends Cell Biol 14: 107–111, 2004 - PubMed
- Das K, Lewis RY, Scherer PE, Lisanti MP. The membrane-spanning domains of caveolins-1 and -2 mediate the formation of caveolin hetero-oligomers. Implications for the assembly of caveolae membranes in vivo. J Biol Chem 274: 18721–18728, 1999 - PubMed
Publication types
MeSH terms
Substances
LinkOut - more resources
Full Text Sources
Molecular Biology Databases
Research Materials
