Two synaptobrevin molecules are sufficient for vesicle fusion in central nervous system synapses - PubMed (original) (raw)
Two synaptobrevin molecules are sufficient for vesicle fusion in central nervous system synapses
Raunak Sinha et al. Proc Natl Acad Sci U S A. 2011.
Abstract
Exocytosis of synaptic vesicles (SVs) during fast synaptic transmission is mediated by soluble N-ethylmaleimide-sensitive factor attachment protein receptor (SNARE) complex assembly formed by the coil-coiling of three members of this protein family: vesicle SNARE protein, synaptobrevin 2 (syb2), and the presynaptic membrane SNAREs syntaxin-1A and SNAP-25. However, it is controversially debated how many SNARE complexes are minimally needed for SV priming and fusion. To quantify this effective number, we measured the fluorescence responses from single fusing vesicles expressing pHluorin (pHl), a pH-sensitive variant of GFP, fused to the luminal domain of the vesicular SNARE syb2 (spH) in cultured hippocampal neurons lacking endogenous syb2. Fluorescence responses were quantal, with the unitary signals precisely corresponding to single pHluorin molecules. Using this approach we found that two copies of spH per SV fully rescued evoked fusion whereas SVs expressing only one spH were unable to rapidly fuse upon stimulation. Thus, two syb2 molecules and likely two SNARE complexes are necessary and sufficient for SV fusion during fast synaptic transmission.
Conflict of interest statement
The authors declare no conflict of interest.
Figures
Fig. 1.
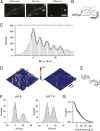
Quantal size of evoked single-vesicle fluorescence response corresponds to single pHluorin molecule. (A) Images of spH transfected synaptic boutons before and after stimulation with 1 AP. Spots on the difference image indicate sites of triggered vesicle fusion. (B) Representative fluorescence profiles of evoked release. (C) Δ_F_ histograms from spH transfected boutons. Bin width is 2.5 a.u. The solid line is the overall fit to multiple Gaussians of fixed quantal size q ± SD. The estimated q for spH is 15.2 ± 0.21 a.u (adjusted R_2 = 0.94 ; n > 400 boutons from 14 experiments). (D) Surface plot of purified pHl in a polyacrylamide gel before (Left) and after (Right) bleaching. (E) Representative intensity traces (average of 3 data points) show instantaneous single-molecule bleaching steps. (F) Single-molecule Δ_F distribution (binned at 2.5 a.u.). Black and gray lines are the overall and individual fits to multiple Gaussians of a mean unitary size (m) of 20.11 ± 1.09 a.u. at pH 9 (n = 195, adjusted _R_2 = 0.94) and 15.06 ± 0.35 a.u. at pH 7.4 (n = 262, adjusted _R_2 = 0.98). (G) Distributions of bleaching waiting times of pHl at pH 9 (black) and 7.4 (gray) are fitted to monoexponential functions (blue, pH9; red, pH7.4) yielding time constants of 7.35 ± 0.43 s at pH 9 and 9.65 ± 0.28 s at pH 7.4.
Fig. 2.
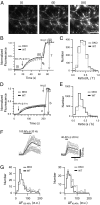
SpH overexpression in syb2/ceb2 DKO hippocampal neurons rescues evoked synaptic transmission. (A) Fluorescence images of DKO hippocampal boutons overexpressing spH before (i) and after (ii) 900 APs stimulation and after NH4Cl application (iii). (B) Representative average fluorescence response (DKO in gray and WT in black; n > 300 boutons from two experiments) to 900 APs at 20 Hz followed by NH4Cl dequenching. R_c denotes the size of the recycling pool, i.e., the relative increase in fluorescence upon stimulation in presence of folimycin, and T denotes the size of the total pool, i.e., the total fluorescence increase after subsequent NH4Cl application. (C) Δ_F distributions of the recycling pool fraction from spH-overexpressing DKO (n > 1,000 boutons from six experiments) and WT (n > 800 boutons from four experiments) boutons are similar. (D) Average fluorescence response (n > 300 boutons from two experiments) to 900 APs at 5 Hz (a) followed by NH4Cl dequenching (b). (E) Δ_F_ distributions of the relative increase in fluorescence upon stimulation (a/b) from spH-overexpressing DKO (n > 1,500 boutons from seven experiments) and WT (n > 1,200 boutons from six experiments) boutons are similar. (F) Fluorescence responses of individual boutons to 100 APs (Left) and 40 APs (Right) at 20 Hz. The average response is overlaid (solid line). (G) Δ_F_ distributions from spH-overexpressing DKO (n > 150 boutons from six experiments) and WT (n > 150 boutons from six experiments) boutons in response to 100 APs (Left) and 40 APs (Right) are similar.
Fig. 3.
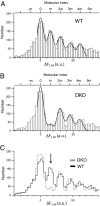
SVs with a single copy of spH do not undergo Ca2+-triggered exocytosis. (A) Δ_F_ distribution from spH-overexpressing WT boutons plotted with bin width of 2.5 a.u. The smooth curve is the overall fit to multiple Gaussians (adjusted R_2 = 0.94). The estimated unitary size is 15.2 ± 0.21 a.u. (n > 400 boutons from 14 experiments). (B) Δ_F distribution from spH-overexpressing DKO boutons plotted with a bin width of 2.5 a.u. The smooth curve is the overall fit to multiple Gaussians (adjusted _R_2 = 0.94). The estimated unitary size is 14.9 ± 0.28 a.u. (n > 400 boutons from 15 experiments). (C) Superimposed intensity distributions for spH-overexpressing WT and DKO boutons. The arrow indicates the marked reduction of the first nonzero peak in spH-overexpressing DKO boutons.
Fig. 4.
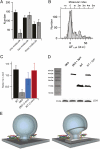
Two copies of spH are minimally required to drive SV fusion. (A) Bar graph comparing the absolute amplitudes of the first, second, and third nonzero peaks of spH Δ_F_ histograms for WT (black) and DKO (gray) boutons. The amplitudes were obtained from the best-fit model (error bars represent SD). (B) Histogram of amplitudes Δ_F_ evoked by 1 AP after 2 min of prebleaching in spH-expressing DKO boutons shows “recovery” of the first nonzero peak. Superimposed is the best-fit Gaussian curve (adjusted _R_2 = 0.89) with a unitary size of 15.0 ± 0.50 a.u. (n > 100 boutons from five experiments). (C) Bar diagram showing relative amplitudes expressed as the ratio of the first nonzero peak to the second nonzero peak for WT (black), DKO (gray), and boutons prebleached for 2 min from DKO (blue) and WT (red) neurons (error bars represent SD). (D) Immunoblot of lysates from DKO, WT, spH-overexpressing DKO or WT neuronal cultures probed with anti-syb2 antibody (mouse monoclonal, 69.1). Endogenous syb2 runs at ∼16 kDa, whereas overexpressed syb2 fused to pHluorin should be shifted by ∼27 kDa. Thus, the single band at ∼40 kDa corresponds to uncleaved spH. Note the absence of any cleaved syb2 product at ∼16 kDa. The loading control used was lactate dehydrogenase (LDH) and shows nearly equal loading of the samples. (E) Illustration of SV fusion driven by two SNARE complexes during neuroexocytosis: assembly of two SNARE complexes with syb2 (blue) and syntaxin-1A (red) contributing one helix and SNAP-25 (green) contributing two helices. The transmembrane regions of the SNARE proteins are depicted in yellow [better seen in the version with a cut-open fusion pore (Right)].
Similar articles
- Vesicular Synaptobrevin/VAMP2 Levels Guarded by AP180 Control Efficient Neurotransmission.
Koo SJ, Kochlamazashvili G, Rost B, Puchkov D, Gimber N, Lehmann M, Tadeus G, Schmoranzer J, Rosenmund C, Haucke V, Maritzen T. Koo SJ, et al. Neuron. 2015 Oct 21;88(2):330-44. doi: 10.1016/j.neuron.2015.08.034. Epub 2015 Sep 24. Neuron. 2015. PMID: 26412491 - Structural determinants of synaptobrevin 2 function in synaptic vesicle fusion.
Deák F, Shin OH, Kavalali ET, Südhof TC. Deák F, et al. J Neurosci. 2006 Jun 21;26(25):6668-76. doi: 10.1523/JNEUROSCI.5272-05.2006. J Neurosci. 2006. PMID: 16793874 Free PMC article. - Synaptobrevin 1 mediates vesicle priming and evoked release in a subpopulation of hippocampal neurons.
Zimmermann J, Trimbuch T, Rosenmund C. Zimmermann J, et al. J Neurophysiol. 2014 Sep 15;112(6):1559-65. doi: 10.1152/jn.00340.2014. Epub 2014 Jun 18. J Neurophysiol. 2014. PMID: 24944211 - Synaptophysin-dependent synaptobrevin-2 trafficking at the presynapse-Mechanism and function.
Cousin MA. Cousin MA. J Neurochem. 2021 Oct;159(1):78-89. doi: 10.1111/jnc.15499. Epub 2021 Sep 9. J Neurochem. 2021. PMID: 34468992 Review. - TRP Channel Trafficking.
Planells-Cases R, Ferrer-Montiel A. Planells-Cases R, et al. In: Liedtke WB, Heller S, editors. TRP Ion Channel Function in Sensory Transduction and Cellular Signaling Cascades. Boca Raton (FL): CRC Press/Taylor & Francis; 2007. Chapter 23. In: Liedtke WB, Heller S, editors. TRP Ion Channel Function in Sensory Transduction and Cellular Signaling Cascades. Boca Raton (FL): CRC Press/Taylor & Francis; 2007. Chapter 23. PMID: 21204515 Free Books & Documents. Review.
Cited by
- All SNAP25 molecules in the vesicle-plasma membrane contact zone change conformation during vesicle priming.
Zhao Y, Fang Q, Sharma S, Jakhanwal S, Jahn R, Lindau M. Zhao Y, et al. Proc Natl Acad Sci U S A. 2024 Jan 9;121(2):e2309161121. doi: 10.1073/pnas.2309161121. Epub 2024 Jan 3. Proc Natl Acad Sci U S A. 2024. PMID: 38170748 Free PMC article. - Imaging the recruitment and loss of proteins and lipids at single sites of calcium-triggered exocytosis.
Trexler AJ, Sochacki KA, Taraska JW. Trexler AJ, et al. Mol Biol Cell. 2016 Aug 1;27(15):2423-34. doi: 10.1091/mbc.E16-01-0057. Epub 2016 Jun 15. Mol Biol Cell. 2016. PMID: 27307587 Free PMC article. - Antibody-driven capture of synaptic vesicle proteins on the plasma membrane enables the analysis of their interactions with other synaptic proteins.
Richter KN, Patzelt C, Phan NTN, Rizzoli SO. Richter KN, et al. Sci Rep. 2019 Jun 25;9(1):9231. doi: 10.1038/s41598-019-45729-4. Sci Rep. 2019. PMID: 31239503 Free PMC article. - Ca2+-Triggered Synaptic Vesicle Fusion Initiated by Release of Inhibition.
Brunger AT, Leitz J, Zhou Q, Choi UB, Lai Y. Brunger AT, et al. Trends Cell Biol. 2018 Aug;28(8):631-645. doi: 10.1016/j.tcb.2018.03.004. Epub 2018 Apr 26. Trends Cell Biol. 2018. PMID: 29706534 Free PMC article. Review. - Examination of Sec22 Homodimer Formation and Role in SNARE-dependent Membrane Fusion.
Flanagan JJ, Mukherjee I, Barlowe C. Flanagan JJ, et al. J Biol Chem. 2015 Apr 24;290(17):10657-66. doi: 10.1074/jbc.M114.626911. Epub 2015 Mar 6. J Biol Chem. 2015. PMID: 25750128 Free PMC article.
References
- Jahn R, Scheller RH. SNAREs—engines for membrane fusion. Nat Rev Mol Cell Biol. 2006;7:631–643. - PubMed
- Söllner T, Bennett MK, Whiteheart SW, Scheller RH, Rothman JE. A protein assembly-disassembly pathway in vitro that may correspond to sequential steps of synaptic vesicle docking, activation, and fusion. Cell. 1993;75:409–418. - PubMed
- Söllner T, et al. SNAP receptors implicated in vesicle targeting and fusion. Nature. 1993;362:318–324. - PubMed
- Hanson PI, Roth R, Morisaki H, Jahn R, Heuser JE. Structure and conformational changes in NSF and its membrane receptor complexes visualized by quick-freeze/deep-etch electron microscopy. Cell. 1997;90:523–535. - PubMed
- Weber T, et al. SNAREpins: Minimal machinery for membrane fusion. Cell. 1998;92:759–772. - PubMed
Publication types
MeSH terms
Substances
LinkOut - more resources
Full Text Sources
Other Literature Sources
Molecular Biology Databases


