Cellular-resolution population imaging reveals robust sparse coding in the Drosophila mushroom body - PubMed (original) (raw)
Comparative Study
Cellular-resolution population imaging reveals robust sparse coding in the Drosophila mushroom body
Kyle S Honegger et al. J Neurosci. 2011.
Abstract
Sensory stimuli are represented in the brain by the activity of populations of neurons. In most biological systems, studying population coding is challenging since only a tiny proportion of cells can be recorded simultaneously. Here we used two-photon imaging to record neural activity in the relatively simple Drosophila mushroom body (MB), an area involved in olfactory learning and memory. Using the highly sensitive calcium indicator GCaMP3, we simultaneously monitored the activity of >100 MB neurons in vivo (∼5% of the total population). The MB is thought to encode odors in sparse patterns of activity, but the code has yet to be explored either on a population level or with a wide variety of stimuli. We therefore imaged responses to odors chosen to evaluate the robustness of sparse representations. Different odors activated distinct patterns of MB neurons; however, we found no evidence for spatial organization of neurons by either response probability or odor tuning within the cell body layer. The degree of sparseness was consistent across a wide range of stimuli, from monomolecular odors to artificial blends and even complex natural smells. Sparseness was mainly invariant across concentrations, largely because of the influence of recent odor experience. Finally, in contrast to sensory processing in other systems, no response features distinguished natural stimuli from monomolecular odors. Our results indicate that the fundamental feature of odor processing in the MB is to create sparse stimulus representations in a format that facilitates arbitrary associations between odor and punishment or reward.
Figures
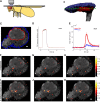
Figure 1.
Odors evoke consistent patterns of calcium activity in the mushroom body. A, Schematic of a fly in the recording platform. Mushroom body is shown in dark gray behind the fly's eye. B, Three-dimensional reconstruction of the MB obtained using the OK107-Gal4 driver. The KC somatic region is shown in blue, the input neuropil region (calyx) in red, and axonal outputs in gray. The green dashed line indicates a typical imaging plane. C, Optical section through the MB showing the clearly distinguishable KC somatic region (blue) and dendrites in the calyx (red). Image is obtained by averaging 12 frames of basal GCaMP3 fluorescence. D, Time courses of 25 pulses of isoamyl acetate measured using a PID (arbitrary units) showing the high reliability of odor delivery. Odor delivery valve opens at t = 0 s and closes at t = 1 s. PID data are smoothed with a 0.1 s boxcar filter. E, Mean change in fluorescence per pixel following presentation of 4-methylcyclohexanol (black bar) in the calyx (red) and KC region (blue) from the optical section shown in C. Thin lines show five individual odor presentation trials and thicker lines show the means. The dF/F values are low because most pixels do not change in intensity. F–K, Basal fluorescence (gray) and mean evoked dF/F (heat map) from the experiment shown in C. Mean dF/F is calculated over 0.5- 4.5 s following stimulus onset. Each row shows responses to three different presentations of the same odor. Responses are evident both in the dendritic region in the calyx (red outline in C) and the cell body area (blue outline in C). The pattern of responding neurons is similar within an odor and different across odors. Scale bars, 10 μm.
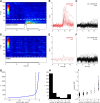
Figure 2.
Detecting odor responses with cellular resolution in single trials. A, dF/F time courses of 121 KCs in response to the presentation of isoamyl acetate (PID trace in gray). KCs are sorted according to the p value of the threshold crossing (see Results). Cells below the dashed white line show a significant response peak at p < 0.01. B, Time courses of the 24 significantly responding cells from A. C, Time courses of the 97 nonresponding cells from A. D–F, Responses of the same 121 cells to one presentation of clean air. G, Cumulative histogram of p values from all cells and all odor presentation trials from a single fly. The α = 0.01 (dashed red line) threshold falls at the elbow of the line, indicating that it represents a reasonable distinction between responding and nonresponding KCs. H, Histogram showing the number of trials in which each cell exhibited a significant response to an odor; data from 121 KCs presented with five different odors (605 KC–odor pairs) for five trials each. Data are bimodally distributed, with some cells responding to only one or two of the five total odor presentations. I, Relationship of response amplitude to response reliability from KC–odor pairs shown in H. Cells exhibiting a larger evoked dF/F also showed more reliable responses. Points are jittered along the _x_-axis for visibility.
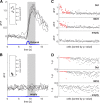
Figure 3.
Reliably identifying KC odor responses. A, Responses of a single KC to five presentations of 3-octanol (black traces). The blue trace shows the kinetics of the odor pulse measured by PID. Response amplitudes (inset) are calculated by averaging activity between 0.5 and 4.5 s following stimulus onset (shaded gray area). B, Responses of the same cell to the clean air control. C, Response amplitudes of the 45 strongest responding neurons from a single optical section to 3-octanol (Oct), 4-methylcyclohexanol (MCH), and clean air. Each data point is the evoked response amplitude from a single cell on a single trial. A cell was deemed responsive to the odor if it responded significantly (p < 0.01) on more than half of the trials. Responsive cells are indicated by red points, nonresponsive cells by gray. Cells are sorted independently for each stimulus according to the mean p value. D, Statistical significance of response peaks from the neurons shown in C. The _y_-axis shows 1 minus the p value. Cells are sorted as in C. Note that responsive cells consistently have values close to 1 on almost all trials; this is not the case for cells classified as nonresponsive.
Figure 4.
Random spatial distribution of responding MB neurons in the cell body layer. A, The proportion (prop.) of odors eliciting a response from each cell (lifetime sparseness). The vast majority of cells do not respond to any tested odor (peak at zero). B, Distribution of p values from a permutation test for clustering of responsive neurons within an optical section. Each data point represents one optical section from an individual fly. Light gray boxes indicate standard deviation around the mean; dark gray box indicates the 95% confidence interval. Only a single imaging plane showed a nominally significant level of clustering (p = 0.04). See Results for details. C, Distribution of p values from a permutation test for clustering of neurons with similar tuning curves. Each data point represents one optical section from an individual fly. We found no evidence for clustering. D, Example imaging planes showing distributions of responsive cells (dark gray). We observed a section with high clustering value (i) and one with a moderate value (ii); neither showed a visibly striking clustering of responsive neurons. E, Tuning curve correlation as a function of distance between cells from a single fly. F, Tuning curve correlation as a function of distance in MDS space (see Results) for the fly shown in E. This plot illustrates that obtaining topography is possible with the tuning curves we observed experimentally.
Figure 5.
Responses to monomolecular odors are sparse in MB. A, Proportion (prop.) of KCs responding to a variety of different odors. Black points show sparseness values from individual animals (n = 8 flies); gray circles show the grand mean. B, Mean sparseness values as a function of total ORN activity [ORN data from Hallem and Carlson (2006)] for each odor. Some KC responses shown in A are not plotted since ORN data do not exist for these odors. The slope of the fit is significantly different from zero (p = 0.0001) (see Results).
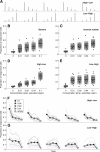
Figure 6.
The effects of odor concentration and recent stimulus history on MB population sparseness. A, Stimuli were delivered in blocks of either increasing or decreasing concentration steps, shown here as the average PID traces acquired during each type of experiment (for details, see Results). B, Proportion of Kenyon cells responding to ripe banana over a range of different odor concentrations. Mean sparseness increases slightly with concentration, but never exceeds 0.2. Each point is the MB response from an individual fly for each concentration from both types of stimulus blocks (jittered along the _x_-axis for clarity); black bars indicate the mean of these points. Light gray boxes indicate standard deviations around the mean and dark boxes indicate the 95% confidence interval. C, Same as B, but for the monomolecular odor isoamyl acetate. D, Data from B and C showing specifically the results from the high-to-low concentration steps. E, As D, but the low-to-high steps. An effect of concentration is only apparent for the high-to-low condition. F–G, Responses on individual trials over the course of an experiment showing that the order in which stimuli were presented affects the sparseness of MB response. Response to the first trial was typically less sparse than subsequent trials. Additionally, the stimulus block type (high-to-low vs low-to-high) affected how sparseness changed with concentration. Gray lines show sparseness estimates from individual flies. Points connected by the black line indicate the mean responses on individual trials of different odorant concentrations (filled circles) or clean air (open circles). Trial blocks have been separated in time for clarity, but experiments were run continuously.
Figure 7.
MB responds sparsely to complex and natural odorants. A, Proportion of KCs responding to 4-methylcyclohexanol (MCH), 3-octanol (Oct), and a 50:50 blend of the two odorants. Points show sparseness values from individual optical sections (n = 4). Grand means shown in red. The sparseness of responses to the blend is very similar to that of the monomolecular components. The pale red point indicates expected proportion of responsive cells if the monomolecular odorants were to sum additively. B, Similar data as A, but from a different experiment using 2-heptanone (2Hep), pentyl-acetate (PA), and their 50:50 blend. C, Responses to blends are predominantly subadditive. Histogram shows the distribution of deviations from linearity for responses to the 3-octanol plus 4-methylcyclohexanol blend compared with the response predicted by linear addition of responses to the individual components. Seventy-three percent of cells responded less to the blend than expected from the sum of the component responses, indicating that the majority of KC responses to the blend are subadditive. D–F, Basal fluorescence (gray) and dF/F overlay (heat map) for responses to 3-octanol, 4-methylcyclohexanol, and the blend of the two odors. Each panel shows data from an individual trial. dF/F values are on the same scale for all panels. G–H, Single-trial responses to two complex natural odors. I, The sparseness values of natural odors (green) compared with a range of different monomolecular odorants (gray). Natural odorants do not evoke responses that are substantially more or less sparse than monomolecular odorants.
Figure 8.
MB population responses to natural and monomolecular odors are indistinguishable. A, Mean response duration (imaging frames) for natural odors (black circles) and monomolecular odors (gray points). B, Standard deviation of response duration. C, Mean evoked response magnitude. D, Standard deviation of evoked response magnitudes. E, LDA-based classification accuracy of natural and monomolecular responses (78%, dashed black bar) compared against chance performance (gray histogram). Observed classification performance was not significantly greater than that of 10,000 chance bootstrap replicates.
Similar articles
- Presynaptic developmental plasticity allows robust sparse wiring of the Drosophila mushroom body.
Elkahlah NA, Rogow JA, Ahmed M, Clowney EJ. Elkahlah NA, et al. Elife. 2020 Jan 8;9:e52278. doi: 10.7554/eLife.52278. Elife. 2020. PMID: 31913123 Free PMC article. - The GABA system regulates the sparse coding of odors in the mushroom bodies of Drosophila.
Lei Z, Chen K, Li H, Liu H, Guo A. Lei Z, et al. Biochem Biophys Res Commun. 2013 Jun 21;436(1):35-40. doi: 10.1016/j.bbrc.2013.05.036. Epub 2013 May 21. Biochem Biophys Res Commun. 2013. PMID: 23707718 - Separate But Interactive Parallel Olfactory Processing Streams Governed by Different Types of GABAergic Feedback Neurons in the Mushroom Body of a Basal Insect.
Takahashi N, Nishino H, Domae M, Mizunami M. Takahashi N, et al. J Neurosci. 2019 Oct 30;39(44):8690-8704. doi: 10.1523/JNEUROSCI.0088-19.2019. Epub 2019 Sep 23. J Neurosci. 2019. PMID: 31548236 Free PMC article. - Central organization of a high-dimensional odor space.
Endo K, Kazama H. Endo K, et al. Curr Opin Neurobiol. 2022 Apr;73:102528. doi: 10.1016/j.conb.2022.102528. Epub 2022 Mar 31. Curr Opin Neurobiol. 2022. PMID: 35367860 Review. - Olfactory learning in Drosophila.
Busto GU, Cervantes-Sandoval I, Davis RL. Busto GU, et al. Physiology (Bethesda). 2010 Dec;25(6):338-46. doi: 10.1152/physiol.00026.2010. Physiology (Bethesda). 2010. PMID: 21186278 Free PMC article. Review.
Cited by
- Selective suppression and recall of long-term memories in Drosophila.
Siegenthaler D, Escribano B, Bräuler V, Pielage J. Siegenthaler D, et al. PLoS Biol. 2019 Aug 27;17(8):e3000400. doi: 10.1371/journal.pbio.3000400. eCollection 2019 Aug. PLoS Biol. 2019. PMID: 31454345 Free PMC article. - Integration of the olfactory code across dendritic claws of single mushroom body neurons.
Gruntman E, Turner GC. Gruntman E, et al. Nat Neurosci. 2013 Dec;16(12):1821-9. doi: 10.1038/nn.3547. Epub 2013 Oct 20. Nat Neurosci. 2013. PMID: 24141312 Free PMC article. - Visualization of learning-induced synaptic plasticity in output neurons of the Drosophila mushroom body γ-lobe.
Hancock CE, Rostami V, Rachad EY, Deimel SH, Nawrot MP, Fiala A. Hancock CE, et al. Sci Rep. 2022 Jun 21;12(1):10421. doi: 10.1038/s41598-022-14413-5. Sci Rep. 2022. PMID: 35729203 Free PMC article. - Dopamine-Dependent Plasticity Is Heterogeneously Expressed by Presynaptic Calcium Activity across Individual Boutons of the Drosophila Mushroom Body.
Davidson AM, Kaushik S, Hige T. Davidson AM, et al. eNeuro. 2023 Oct 30;10(10):ENEURO.0275-23.2023. doi: 10.1523/ENEURO.0275-23.2023. Print 2023 Oct. eNeuro. 2023. PMID: 37848287 Free PMC article. - Effects of stochastic coding on olfactory discrimination in flies and mice.
Srinivasan S, Daste S, Modi MN, Turner GC, Fleischmann A, Navlakha S. Srinivasan S, et al. PLoS Biol. 2023 Oct 31;21(10):e3002206. doi: 10.1371/journal.pbio.3002206. eCollection 2023 Oct. PLoS Biol. 2023. PMID: 37906721 Free PMC article.
References
- Aso Y, Grübel K, Busch S, Friedrich AB, Siwanowicz I, Tanimoto H. The mushroom body of adult Drosophila characterized by GAL4 drivers. J Neurogenet. 2009;23:156–172. - PubMed
- Broome BM, Jayaraman V, Laurent G. Encoding and decoding of overlapping odor sequences. Neuron. 2006;51:467–482. - PubMed
- Budick SA, Dickinson MH. Free-flight responses of Drosophila melanogaster to attractive odors. J Exp Biol. 2006;209:3001–3017. - PubMed
- Connolly JB, Roberts IJ, Armstrong JD, Kaiser K, Forte M, Tully T, O'Kane CJ. Associative learning disrupted by impaired Gs signaling in Drosophila mushroom bodies. Science. 1996;274:2104–2107. - PubMed
Publication types
MeSH terms
LinkOut - more resources
Full Text Sources
Other Literature Sources
Molecular Biology Databases
Miscellaneous


