The human mitochondrial transcriptome - PubMed (original) (raw)
. 2011 Aug 19;146(4):645-58.
doi: 10.1016/j.cell.2011.06.051.
Shane Neph, Marcel E Dinger, Joanna Crawford, Martin A Smith, Anne-Marie J Shearwood, Eric Haugen, Cameron P Bracken, Oliver Rackham, John A Stamatoyannopoulos, Aleksandra Filipovska, John S Mattick
Affiliations
- PMID: 21854988
- PMCID: PMC3160626
- DOI: 10.1016/j.cell.2011.06.051
The human mitochondrial transcriptome
Tim R Mercer et al. Cell. 2011.
Abstract
The human mitochondrial genome comprises a distinct genetic system transcribed as precursor polycistronic transcripts that are subsequently cleaved to generate individual mRNAs, tRNAs, and rRNAs. Here, we provide a comprehensive analysis of the human mitochondrial transcriptome across multiple cell lines and tissues. Using directional deep sequencing and parallel analysis of RNA ends, we demonstrate wide variation in mitochondrial transcript abundance and precisely resolve transcript processing and maturation events. We identify previously undescribed transcripts, including small RNAs, and observe the enrichment of several nuclear RNAs in mitochondria. Using high-throughput in vivo DNaseI footprinting, we establish the global profile of DNA-binding protein occupancy across the mitochondrial genome at single-nucleotide resolution, revealing regulatory features at mitochondrial transcription initiation sites and functional insights into disease-associated variants. This integrated analysis of the mitochondrial transcriptome reveals unexpected complexity in the regulation, expression, and processing of mitochondrial RNA and provides a resource for future studies of mitochondrial function (accessed at http://mitochondria.matticklab.com).
Copyright © 2011 Elsevier Inc. All rights reserved.
Figures
Figure 1
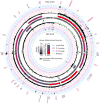
Map of the human mitochondrial genome indicating the following features (from centre with outer tracks corresponding to heavy strand and inner track corresponding to light strand); DNase sensitivity profile (central black track, opacity indicates strength according to central key), RNA secondary structures predicted by SISSIz (green track), annotated gene features (blue/red gradient indicates fraction of total mitochondrial gene expression according to central key), RNA sequencing (black histogram on grey background, scale 0-900000[log10]), 5′ RNA cleavage sites determined by PARE (black histogram on pink background, scale 0-8000), 3′ cleavage sites determined by non-template polyadenylation RNAseq reads (black histogram on purple background, scale 0-8000) and small RNA profile (black histogram on blue background, scale 0-2500).
Figure 2
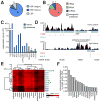
(A) Mitochondrial gene expression. Proportion of RNAseq reads aligning to three primary polycistronic transcripts transcribed for the heavy major (HSP; light blue), heavy minor (HSP; dark blue) and light strand promoters (LSP; grey). (B) Proportion of RNAseq reads mapping to rRNA, tRNA, mRNA and intergenic or antisense regions of the mitochondrial genome. (C) Mitochondrial gene expression (blue) determined by RNAseq in human 143B mitochondria (mitoplast) preparations (error bars indicate 95%CI). Antisense transcription (green) to each gene is also shown with notable antisense transcription to ND5 indicated (asterisk). (D) Genome browser illustration of heavy and light strand showing ND5 and ND6 mRNAs (blue) and complementary antisense regions. Black histogram indicates RNAseq read distribution across browser view, including extended region of high transcription antisense to ND5 mRNA, PARE (red) and poly-A (blue) histogram indicate transcript 5′ and 3′ ends, respectively. (E) Hierarchical clustering of mitochondrial gene expression across 16 human tissues. (Pearson's correlation [_r2_] indicated. Rpbm; sequenced reads per base per million) (F) Histogram indicates the proportion of total polyA+ RNA mapping uniquely and exactly to the mitochondrial genome across 16 human tissues.
Figure 3
(A,B) Relative enrichment of nuclear-encoded RNAs in mitochondria or mitoplast preparations. Proportion of sequenced reads aligning to nuclear (red) and mitochondrial (blue) genomes in libraries derived from mitochondria (A) and mitoplast (B) preparations. Comparison between libraries indicates the depletion of co-purifying contaminant transcripts in mitoplast preparations. (C) Box whisker plot indicates enrichment for mitochondrial encoded (blue) mRNAs, rRNA and tRNA in mitoplast relative to whole mitochondrial RNA preparations. While the majority of nuclear-encoded (red) mRNAs and rRNAs are depleted in mitoplast preparations, nuclear tRNAs are enriched in mitoplasts. (D,E) qRT-PCR confirmation for mitoplast depletion of mRNAs (D) and miRNAs (E) for which we observed the highest expression in whole mitochondrial preparations. (F) Scatter-plot indicating the normalised expression for nuclear (red) and mitochondrial (blue) tRNAs, showing the enrichment of several nuclear tRNAs, including tRNA-LeuUAA (p-value<0.001) and tRNA-GlnUUG (p-value=0.003) in mitoplasts. (G) qRT-PCR shows the depletion of nuclear tRNA-AlaAGC and tRNA-LysUUU in mitoplasts, and enrichment of tRNA-GluUUG (p-value=0.025) and presence of tRNA-LeuUAA within mitoplasts. 12S rRNA included as positive control (all error bars indicate SEM).
Figure 4
(A) Mitochondrial position of 5′ cleavage sites. Cleavage sites determined by PARE with total (green) and polyA+ (blue) human RNA and 3′ cleavage sites determined by RNAseq reads containing non-template –CCA (purple) and polyA additions (orange) are indicated. (B-E). Frequency distribution of (B) PARE reads from total RNA across window centred on annotated tRNA 5′ end, (C) non-template –CCA sites across window centred on annotated tRNA 3′ end. (D) Frequency distribution of PARE reads from poly-A+ RNA across window centred on annotated mRNA 5′ end, (E) non-template poly-A sites across window centred on annotated mRNA 3′ end. (F) Annotation of ND6 3′UTR by 3′ RACE. The 3′UTR sequence with stop codon (black) and -1 shifted codon (red) is indicated (top panel). Gel electrophoresis of product retrieved from ND6 3′RACE shown in lower panel.
Figure 5
(A) Mitochondrial positions of small RNAs (red). Internal pie-graph indicates majority of highly expressed small RNAs primarily associated with tRNAs (dark blue). (B) Size distribution for small RNAs derived from human 143B whole cells (green), mitochondria (blue) and highly expressed (>1,048 reads; red). (C) Small RNA frequency distribution associated with mitochondria tRNA genes indicates two distinct species immediately downstream of 5′ and 3′ processing sites.
Figure 6
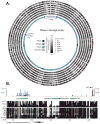
(A) DNaseI footprinting across the mitochondrial genome provides global profile of protein-DNA interactions at single nucleotide resolution. Cleavage tracks indicate normalised percentile DNaseI cleavage frequency relative to the mtDNA (0-75%). Annotated genomic features including mRNA (light blue), tRNA (dark blue) and rRNA (green) with D-loop and MTERF1 binding site are indicated. (B) Detailed view of D-loop region. Top panel histogram showing PARE (red) and polyA+ (blue) read frequency distribution, indicating transcription initiation and termination events. Previously identified conserved elements (CS; green bars) and replication primer site (blue bars; retrieved from
) and novel motif (#59; grey bar) also indicated. DNaseI cleavage profile indicates the normalised percentile DNaseI cleavage frequency (0-25%).
Figure 7
(A) Hierarchical cluster diagram indicating the sensitivity of top 100 indentified DNaseI footprints. Footprints corresponding to TFAM and MTERF1 biding sites are indicated. (B) DNaseI footprint at mTERF binding site. Cleavage events associated with transcription termination are indicated by PARE (blue histogram) and non-template polyadenylation RNAseq reads (red histogram). DNaseI cleavage frequency in HeLa cells indicated by black histogram and frequency in other cell lines indicated by density plot. Underlined green nucleotides indicate MTERF1 binding. (C) Commonly recurring novel sequence motif #59 (top panel; error bars show twice sample correction according to WebLogo; Crooks et al., 2004) and example of novel cell-specific footprint (bottom panel) (D) Association of T16189C SNP variant with distorted footprint. An extended footprint (blue bar) is present in 3 cell lines with C variant (green) but absent in cell lines with T variant (blue). (E) Histogram indicates significant increase in DNaseI cleavage frequency in cell lines containing variant 16189T allele as compared to 16189C allele (error bars indicate SEM).
Similar articles
- RNA processing in human mitochondria.
Sanchez MI, Mercer TR, Davies SM, Shearwood AM, Nygård KK, Richman TR, Mattick JS, Rackham O, Filipovska A. Sanchez MI, et al. Cell Cycle. 2011 Sep 1;10(17):2904-16. doi: 10.4161/cc.10.17.17060. Epub 2011 Sep 1. Cell Cycle. 2011. PMID: 21857155 - Investigating Mitochondrial Transcriptomes and RNA Processing Using Circular RNA Sequencing.
Kuznetsova I, Rackham O, Filipovska A. Kuznetsova I, et al. Methods Mol Biol. 2021;2192:43-57. doi: 10.1007/978-1-0716-0834-0_4. Methods Mol Biol. 2021. PMID: 33230764 - Deciphering tissue-specific expression profiles of mitochondrial genome-encoded tRNAs and rRNAs through transcriptomic profiling in buffalo.
Sadeesh EM, Malik A. Sadeesh EM, et al. Mol Biol Rep. 2024 Jul 31;51(1):876. doi: 10.1007/s11033-024-09815-9. Mol Biol Rep. 2024. PMID: 39083182 - The human mitochondrial transcriptome and the RNA-binding proteins that regulate its expression.
Rackham O, Mercer TR, Filipovska A. Rackham O, et al. Wiley Interdiscip Rev RNA. 2012 Sep-Oct;3(5):675-95. doi: 10.1002/wrna.1128. Epub 2012 Jul 9. Wiley Interdiscip Rev RNA. 2012. PMID: 22777840 Review. - Is mitochondrial gene expression coordinated or stochastic?
Lee RG, Rudler DL, Rackham O, Filipovska A. Lee RG, et al. Biochem Soc Trans. 2018 Oct 19;46(5):1239-1246. doi: 10.1042/BST20180174. Epub 2018 Oct 8. Biochem Soc Trans. 2018. PMID: 30301847 Review.
Cited by
- Role of microRNA in metabolic shift during heart failure.
Pinti MV, Hathaway QA, Hollander JM. Pinti MV, et al. Am J Physiol Heart Circ Physiol. 2017 Jan 1;312(1):H33-H45. doi: 10.1152/ajpheart.00341.2016. Epub 2016 Oct 14. Am J Physiol Heart Circ Physiol. 2017. PMID: 27742689 Free PMC article. Review. - Coordinated regulation of synthesis and stability of RNA during the acute TNF-induced proinflammatory response.
Paulsen MT, Veloso A, Prasad J, Bedi K, Ljungman EA, Tsan YC, Chang CW, Tarrier B, Washburn JG, Lyons R, Robinson DR, Kumar-Sinha C, Wilson TE, Ljungman M. Paulsen MT, et al. Proc Natl Acad Sci U S A. 2013 Feb 5;110(6):2240-5. doi: 10.1073/pnas.1219192110. Epub 2013 Jan 23. Proc Natl Acad Sci U S A. 2013. PMID: 23345452 Free PMC article. - Reproducibility efforts as a teaching tool: A pilot study.
Karathanasis N, Hwang D, Heng V, Abhimannyu R, Slogoff-Sevilla P, Buchel G, Frisbie V, Li P, Kryoneriti D, Rigoutsos I. Karathanasis N, et al. PLoS Comput Biol. 2022 Nov 10;18(11):e1010615. doi: 10.1371/journal.pcbi.1010615. eCollection 2022 Nov. PLoS Comput Biol. 2022. PMID: 36355750 Free PMC article. - Mitochondrial Gene Expression and Beyond-Novel Aspects of Cellular Physiology.
Kotrys AV, Szczesny RJ. Kotrys AV, et al. Cells. 2019 Dec 19;9(1):17. doi: 10.3390/cells9010017. Cells. 2019. PMID: 31861673 Free PMC article. Review.
References
- Anderson S, Bankier AT, Barrell BG, de Bruijn MH, Coulson AR, Drouin J, Eperon IC, Nierlich DP, Roe BA, Sanger F, et al. Sequence and organization of the human mitochondrial genome. Nature. 1981;290:457–465. - PubMed
- Bhat A, Koul A, Sharma S, Rai E, Bukhari SI, Dhar MK, Bamezai RN. The possible role of 10398A and 16189C mtDNA variants in providing susceptibility to T2DM in two North Indian populations: a replicative study. Hum Genet. 2007;120:821–826. - PubMed
- Cannino G, Di Liegro CM, Rinaldi AM. Nuclear-mitochondrial interaction. Mitochondrion. 2007;7:359–366. - PubMed
- Crimi M, Del Bo R, Galbiati S, Sciacco M, Bordoni A, Bresolin N, Comi GP. Mitochondrial A12308G polymorphism affects clinical features in patients with single mtDNA macrodeletion. Eur J Hum Genet. 2003;11:896–898. - PubMed
Publication types
MeSH terms
Substances
LinkOut - more resources
Full Text Sources
Other Literature Sources
Molecular Biology Databases


