miRNA-mediated feedback inhibition of JAK/STAT morphogen signalling establishes a cell fate threshold - PubMed (original) (raw)
miRNA-mediated feedback inhibition of JAK/STAT morphogen signalling establishes a cell fate threshold
Wan Hee Yoon et al. Nat Cell Biol. 2011.
Abstract
Patterns of cell fates generated by morphogens are critically important for normal development; however, the mechanisms by which graded morphogen signals are converted into all-or-none cell fate responses are incompletely understood. In the Drosophila ovary, high and sustained levels of the secreted morphogen Unpaired (Upd) specify the migratory border-cell population by activating the signal transducer and activator of transcription (STAT). A lower or transient level of STAT activity specifies a non-migratory population of follicle cells. Here we identify miR-279 as a component of a feedback pathway that further dampens the response in cells with low levels of JAK/STAT activity. miR-279 directly repressed STAT, and loss of miR-279 mimicked STAT gain-of-function or loss of Apontic (Apt), a known feedback inhibitor of STAT. Apt was essential for miR-279 expression in non-migratory follicle cells, whereas another STAT target, Ken and Barbie (Ken), downregulated miR-279 in border cells. Mathematical modelling and simulations of this regulatory circuit including miR-279, Apt and Ken supported key roles for miR-279 and Apt in generating threshold responses to the Upd gradient.
Figures
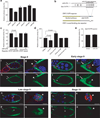
Figure 1. STAT is a target of miR-279
(a) Effect of miRNAs on expression of a Renilla luciferase reporter carrying the STAT 3’UTR in S2 cells. Error bars indicate SEM. P values were calculated using an ANOVA test. *P<0.05. Effects of _miR-284_, _miR-277_, _miR-92a_ and _miR-280_ were not significantly different from the control (_P_>0.3). (b) Schematic representation of miR-279 pairing with the STAT 3‘UTR. Lines indicate canonical pairings and double dots indicate non-canonical (G:U) pairings. The seed pairings are underlined. Schematic representation of STAT 3‘UTR reporter with and without the miR-279 seed-binding site (blue). Yellow box represents Renilla luciferase coding sequence and white box represents the 3’UTR. (c) Effect of miR-279 on expression of a Renilla luciferase reporter carrying the STAT 3’UTR with or without the miR-279 seed-binding sequence. Error bars represent SEMs. P value was calculated using a Student’s t test. (d) De-repression of the STAT 3’UTR reporter by 2‘O-methyl miR-279 antagomir in S2 cells. Error bars represent SEM. P values were calculated using ANOVA. (e) Effect of miR-279 on expression of a Renilla luciferase reporter carrying the Upd 3’UTR in S2 cells. Error bar indicates SEM. Relative luciferase activity is the ratio of Renilla luciferase activity to a firefly luciferase control. (a, c, d, e) (f–u) Confocal micrographs of egg chambers of indicated stages carrying a miR-279 expression reporter (miR-279-GAL4; UAS-GFP). DAPI (blue) labels nuclei, and Armadillo (red) labels membranes enriched in adherens junction proteins. Arrowheads indicate the border cell cluster, arrows indicate non-migratory anterior epithelial follicle cells, and asterisks indicate polar cells. Scale bars represent 50 µ in f, j, n, and r, and 10 µ in g, k, o and s.
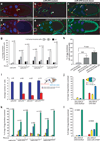
Figure 2. Loss-of-function of miR-279 phenocopies gain-of-function of STAT
(a–f) Confocal micrographs of stage 10 egg chambers of the indicated genotypes. (a, b) MARCM analysis of control (a) and miR-279 mutant (b) follicle cells. Homozygous mutant cells express GFP (green). Scale bar represents 50 µ. (c) miR-279 knockdown in follicle cells. Arrows indicate extra invasive cells in b and c. (d) A stage 10 egg chamber in which STAT was overexpressed in border cells using slbo-GAL4. (e) Mosaic analysis of the miR-279S036207 allele. Homozygous mutant cells lack GFP and fail to migrate. (f) miR-279 knockdown in border cells. Arrowheads indicate border cell cluster (a–f). (g) Quantification of extra invasive cells in egg chambers mosaic for the indicated miR-279 alleles in the presence (+) or absence (−) of a transgene containing the wild-type miR-279 gene. White, gray, and black bars indicate percentage of egg chamber with zero, one, or two or more extra invasive cells, respectively. (h) Effect of miR-279 sponge (miR-279SP) expression on the percentage of egg chambers containing extra invasive cells. Error bars represent SEM. P values were calculated using a Student’s t test. N/S, not significant (i) Effect of the indicated miR-279 alleles on the number of cells in the border cell cluster (blue) and number of extra invasive cells (red) as depicted in the schematic. Error bards represent SEM. (j) Effect on border cell migration of expressing UAS-DsRed or UAS-STAT with slbo-GAL4. Schematic representation of stage10 egg chamber showing the approach used for quantification of border cell migration. Red shading indicates the region of the egg chamber in which border cells appear when they fail to migrate. Yellow and blue indicate incomplete migration, and green indicates complete migration. (k) Migration of border cell clusters composed entirely of homozygous mutant cells of the indicated miR-279 alleles in the presence (+) or absence (−) of a transgene containing the wild-type miR-279 gene. (l) Effect on border cell migration of expressing UAS-DsRed or UAS-miR-279SP with slbo-GAL4.
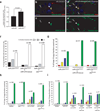
Figure 3. STAT is a critical target of miR-279 in vivo
(a) Comparison of nuclear STAT levels in wild-type versus homozygous miR-279⊗1.2 mutant border cells in mosaic clusters (see methods). Error bars represent SEM. P value was calculated using a Student’s t test. (b–e) Confocal micrographs of stage 10 egg chambers of the indicated genotypes. GFP expression (green) reflects STAT activity. DAPI (blue) labels nuclei, and Armadillo (red) labels membranes. Arrowheads indicate border cells and arrows indicate non-migratory anterior follicle cells. Scale bars represent 50 µ. (f–i) Genetic interactions between miR-279 and stat. (f) Quantification of egg chambers possessing extra-invasive cells following induction of miR-279 mutant clones in the presence of a rescuing transgene or homozygous for a hypomorphic stat allele (statep3391). White, gray, and black bars indicate percentage of egg chamber with zero, one, or two or more extra invasive cells, respectively. (g–i) Quantification of border cell migration defects in stage 10 egg chambers. Red indicates no migration; yellow and blue indicate incomplete migration; green indicates complete migration, as in Figure 3. (g) Egg chambers containing border cell clusters composed entirely of homozygous miR-279 mutant cells in the presence of a rescuing transgene or homozygous for a hypomorphic stat allele (statep3391). (h) All egg chambers carry slbo-GAL4, with or without UAS-miR-279 sponge (miR-279 SP) and/or statep3391/+, as indicated. Error bars represent SEMs. (i) All egg chambers carry slbo-GAL4, with or without UAS-miR-279 in combination with UAS- STAT wt 3’UTR, which includes both coding and 3‘UTR sequences or UAS- STAT mutant (mut) 3’UTR in which the miR-279 seed was deleted. Error bars represent SEMs.
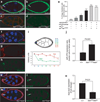
Figure 4. Two STAT targets, Apt and Ken, feed back via miR-279
(a–d) Confocal micrographs of stage 8 wild-type (a, b) or apt mutant background (aptKG05830/apt167) (c, d) egg chambers carrying a miR-279 expression reporter (miR-279-GAL4; UAS-GFP). DAPI (blue) labels nuclei, and Armadillo (red) labels membranes enriched in adherens junction proteins. Arrowheads indicate the border cell cluster and arrows indicate non- migratory anterior follicle cells. Scale bars represent 20 µ. (e) Quantification of egg chambers of the indicated genetic backgrounds displaying extra invasive cells. Error bars represent SEMs. P values were calculated using ANOVA. *P<0.05, ***P<0.001 (f–i) Expression patterns of Apt and Ken in early stage 9 egg chambers (f–h) Confocal micrographs of early stage 9 egg chambers carrying a ken reporter expressing beta-galactosidase under the control of the ken locus (PZ ken1) (f, h, green) also stained for Apt (f, g, red). Scale bars represent 20 µ. (i) Relative levels of nuclear staining intensity of each STAT target relative to DAPI staining intensity plotted as a function of distance from the polar cells. The border cells develop immediately next to the polar cells. Fc2 indicates the cell next to the border cells, fc3 the next cell, as indicated in the drawing (n=4, mean±SEM). (j) The ratio of miR-279 expression in border cells to that in follicle cells in control and ken mutant (kenk11035/ken1) egg chambers at stage 8. (k–n) Confocal micrographs of stage 8 egg chambers carrying a ken expression reporter (Ken-lacZ) (green) in a wild-type (k, l) or stat mutant (stat397/statts) (m, n). DAPI (blue) labels nuclei, and STAT staining is shown in red. Arrows indicate border cells. (o) Ken-lacZ expression in control versus stat mutant border cells at the non-permissive temperature. Error bars represent SEM. P value was calculated using a Student’s t test.
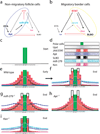
Figure 5. A model of the gene regulatory circuit required to specify non-migratory anterior follicle cell and migratory border cell fate
(a, b) Schematic model of the gene regulatory circuit including miR-279, STAT, Apt, Ken, and SLBO. (a)The blue circle highlights the negative feedback loop that represses STAT expression/activity in non-migratory follicle cells. (b) The yellow circle highlights the positive feedback loop amplifying STAT expression/activity in migratory border cells. Mutual repression of SLBO and Apt, and the effect of EYA on Apt are also indicated, as previously reported,. (c–i) Computer simulations based on the differential equations provided in the methods. (c) Initial condition: the polar cells (green) are specified. Fc1 indicates the follicle cell next to the polar cell (pc), fc2 the next cell, and so on. (d) Schematic representation of stable steady state protein distributions within the field of cells; pixel density corresponds to concentrations (for equations and parameters see methods and Supplementary information, Table1). (e–i) Representations of protein distributions in wild-type and indicated mutants. Height of the bars is proportional to protein concentration. (e) The distributions in wild-type at an early time point. (f) Wild-type distributions at a late time point, i.e. steady state. STAT, SLBO and Ken have all reached high levels near the polar cells and have decayed in the rest of the field. (g, h) This sharpening does not occur if either miR-279 (g) or apt (h) is removed. (i) Loss of Ken does not prevent the threshold response.
Similar articles
- Feedback inhibition of Jak/STAT signaling by apontic is required to limit an invasive cell population.
Starz-Gaiano M, Melani M, Wang X, Meinhardt H, Montell DJ. Starz-Gaiano M, et al. Dev Cell. 2008 May;14(5):726-38. doi: 10.1016/j.devcel.2008.03.005. Dev Cell. 2008. PMID: 18477455 - Interpretation of the UPD/JAK/STAT morphogen gradient in Drosophila follicle cells.
Starz-Gaiano M, Melani M, Meinhardt H, Montell D. Starz-Gaiano M, et al. Cell Cycle. 2009 Sep 15;8(18):2917-25. doi: 10.4161/cc.8.18.9547. Epub 2009 Sep 16. Cell Cycle. 2009. PMID: 19729999 Free PMC article. - The Drosophila BCL6 homolog Ken and Barbie promotes somatic stem cell self-renewal in the testis niche.
Issigonis M, Matunis E. Issigonis M, et al. Dev Biol. 2012 Aug 15;368(2):181-92. doi: 10.1016/j.ydbio.2012.04.034. Epub 2012 May 8. Dev Biol. 2012. PMID: 22580161 Free PMC article. - Organogenesis and tumorigenesis: insight from the JAK/STAT pathway in the Drosophila eye.
Wang YH, Huang ML. Wang YH, et al. Dev Dyn. 2010 Oct;239(10):2522-33. doi: 10.1002/dvdy.22394. Dev Dyn. 2010. PMID: 20737505 Free PMC article. Review. - JAK/STAT signalling in Drosophila: insights into conserved regulatory and cellular functions.
Arbouzova NI, Zeidler MP. Arbouzova NI, et al. Development. 2006 Jul;133(14):2605-16. doi: 10.1242/dev.02411. Development. 2006. PMID: 16794031 Review.
Cited by
- Regulatory non-coding RNAs: revolutionizing the RNA world.
Huang B, Zhang R. Huang B, et al. Mol Biol Rep. 2014 Jun;41(6):3915-23. doi: 10.1007/s11033-014-3259-6. Epub 2014 Feb 19. Mol Biol Rep. 2014. PMID: 24549720 Review. - Tiny giants of gene regulation: experimental strategies for microRNA functional studies.
Steinkraus BR, Toegel M, Fulga TA. Steinkraus BR, et al. Wiley Interdiscip Rev Dev Biol. 2016 May-Jun;5(3):311-62. doi: 10.1002/wdev.223. Epub 2016 Mar 7. Wiley Interdiscip Rev Dev Biol. 2016. PMID: 26950183 Free PMC article. Review. - B Cell Lymphoma 6 (BCL6): A Conserved Regulator of Immunity and Beyond.
Liongue C, Almohaisen FLJ, Ward AC. Liongue C, et al. Int J Mol Sci. 2024 Oct 11;25(20):10968. doi: 10.3390/ijms252010968. Int J Mol Sci. 2024. PMID: 39456751 Free PMC article. Review. - Identification of Novel Regulators of the JAK/STAT Signaling Pathway that Control Border Cell Migration in the Drosophila Ovary.
Saadin A, Starz-Gaiano M. Saadin A, et al. G3 (Bethesda). 2016 Jul 7;6(7):1991-2002. doi: 10.1534/g3.116.028100. G3 (Bethesda). 2016. PMID: 27175018 Free PMC article. - MicroRNA governs bistable cell differentiation and lineage segregation via a noncanonical feedback.
Li CJ, Liau ES, Lee YH, Huang YZ, Liu Z, Willems A, Garside V, McGlinn E, Chen JA, Hong T. Li CJ, et al. Mol Syst Biol. 2021 Apr;17(4):e9945. doi: 10.15252/msb.20209945. Mol Syst Biol. 2021. PMID: 33890404 Free PMC article.
References
- Silver DL, Montell DJ. Paracrine signaling through the JAK/STAT pathway activates invasive behavior of ovarian epithelial cells in Drosophila. Cell. 2001;107:831–841. - PubMed
- Ghiglione C, et al. The Drosophila cytokine receptor Domeless controls border cell migration and epithelial polarization during oogenesis. Development. 2002;129:5437–5447. - PubMed
- Xi R, McGregor JR, Harrison DA. A gradient of JAK pathway activity patterns the anterior-posterior axis of the follicular epithelium. Dev Cell. 2003;4:167–177. - PubMed
- Starz-Gaiano M, Melani M, Wang X, Meinhardt H, Montell DJ. Feedback inhibition of Jak/STAT signaling by apontic is required to limit an invasive cell population. Dev Cell. 2008;14:726–738. - PubMed
- Driever W, Nusslein-Volhard C. The bicoid protein determines position in the Drosophila embryo in a concentration-dependent manner. Cell. 1988;54:95–104. - PubMed
Publication types
MeSH terms
Substances
LinkOut - more resources
Full Text Sources
Molecular Biology Databases
