Parkinson's disease induced pluripotent stem cells with triplication of the α-synuclein locus - PubMed (original) (raw)
Mina Ryten, Petr Vodicka, Alison J Thomson, Tom Burdon, Henry Houlden, Fatima Cavaleri, Masumi Nagano, Nicola J Drummond, Jan-Willem Taanman, Anthony H Schapira, Katrina Gwinn, John Hardy, Patrick A Lewis, Tilo Kunath
Affiliations
- PMID: 21863007
- PMCID: PMC3265381
- DOI: 10.1038/ncomms1453
Parkinson's disease induced pluripotent stem cells with triplication of the α-synuclein locus
Michael J Devine et al. Nat Commun. 2011.
Abstract
A major barrier to research on Parkinson's disease is inaccessibility of diseased tissue for study. One solution is to derive induced pluripotent stem cells from patients and differentiate them into neurons affected by disease. Triplication of SNCA, encoding α-synuclein, causes a fully penetrant, aggressive form of Parkinson's disease with dementia. α-Synuclein dysfunction is the critical pathogenic event in Parkinson's disease, multiple system atrophy and dementia with Lewy bodies. Here we produce multiple induced pluripotent stem cell lines from an SNCA triplication patient and an unaffected first-degree relative. When these cells are differentiated into midbrain dopaminergic neurons, those from the patient produce double the amount of α-synuclein protein as neurons from the unaffected relative, precisely recapitulating the cause of Parkinson's disease in these individuals. This model represents a new experimental system to identify compounds that reduce levels of α-synuclein, and to investigate the mechanistic basis of neurodegeneration caused by α-synuclein dysfunction.
© 2011 Macmillan Publishers Limited. All rights reserved.
Figures
Figure 1. Multiple iPSC lines derived from a PD patient with SNCA triplication and an unaffected relative exhibit hallmarks of pluripotency.
(a) Western blot analysis of AST and NAS fibroblasts confirms a lack of α-synuclein protein. Lysate of SH-SY5Y neuroblastoma cells transfected with an α-synuclein expressing plasmid was used as a positive control, and β-actin as a loading control. (b) Phase contrast images of AST and NAS fibroblasts and de novo iPSC colonies on SNL feeder cells at day 20 post-viral transduction. Scale bar, 100 μm. (c) Quantitative RT–PCR for retroviral transgene expression of the four reprogramming factors (Oct4, Sox2, c-Myc, Klf4). Expression in iPSC lines was normalized to transgene expression of NAS fibroblasts 3 days post-viral transduction (NAS VT). Also shown are negative controls: untransduced fibroblasts (NAS fibs) and human ESCs (Shef4 hESC). (d, e) Representative iPSC colonies derived from NAS fibroblasts (d) and AST fibroblasts (e) stained positive for the pluripotency markers OCT4, SSEA4, TRA-1-81 and NANOG. Scale bar, 100 μm. (f) Endogenous expression of OCT4, SOX2, NANOG and REX1 in two AST and two NAS iPSC lines, normalized to expression in human ESCs (Shef4), found a similar expression profile in all lines examined. Expression of these genes was absent in human fibroblasts (not shown). Error bars represent standard deviation of technical replicates, _n_=3.
Figure 2. Triplication region is maintained in patient-derived fibroblasts and iPSCs.
(a) Quantitative genomic PCR for SNCA exons 1 and 4 demonstrates doubling of gene dosage in patient-derived AST iPSC lines when compared with NAS iPSC lines. Representative data shown. SNCA was normalized to β-globin (HBB) and β2-microglobulin (B2MG). (b) SNP profiles of chromosome 4q22 in DNA from unaffected relative blood, fibroblasts and iPSCs demonstrates that this region is normal. (c) The same region analysed in DNA from patient blood, fibroblasts and iPSCs confirms that the triplication region is present and is retained during reprogramming. (d) The triplication region is defined as chr4:89,375,425 to 90,880,891, spanning the following genes: HERC5, PIGY, HERC3, NAP1L5, FAM13AOS, FAM13A, TIGD2, GPRIN3, SNCA and MMRN1. LOC644248 is also in the triplication region but not yet defined by RefSeq. (e) Genome-wide SNP analysis of NAS9 iPSCs identified the following chromosomal abnormalities: a small deletion at the end of Chr4q, a duplication of part of Chr5q and an extended run of homozygosity occupying most of Chr12q.
Figure 3. Patient and control iPSC lines differentiate efficiently into midbrain dopaminergic neurons.
(a) Schematic of the dual SMAD inhibition/floor plate protocol used to promote differentiation of iPSCs to a midbrain dopaminergic fate. (b) Immunocytochemistry of neuralized AST and NAS iPSCs for TuJ1 (red) and tyrosine hydroxylase (TH – green) shows robust differentiation into dopaminergic neurons. Scale bar, 100 μm. (c) Counts of TH+ neurons, expressed as a percentage of TuJ1+ neurons (_n_=1955 total), found no significant difference in efficiency of dopaminergic differentiation between AST and NAS iPSCs. Error bars represent standard deviation of biological replicates, _n_=3. (d) LMX1B (green) is expressed in the majority of TH+ (red) neurons (>80%). A minority of TH+ cells are negative for LMX1B (arrowheads). Scale bar, 100 μm. (e) Quantitative RT–PCR analysis for midbrain dopaminergic neural markers (LMX1A, NURR1, TH and DAT) in AST and NAS neuronal cultures. To control for efficiency of neuralization we normalized expression to the pan-neuronal marker MAPT. Error bars represent standard deviation of technical replicates, _n_=3. (f) SNP analysis of AST-derived neurons confirms that the triplication region is retained intact following neuronal differentiation.
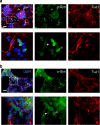
Figure 4. Expression of α-synuclein in iPSC-derived neuronal cultures is heterogeneous.
Expression of α-synuclein was observed in all TuJ1+ neurons derived from AST (a) and NAS (b) iPSCs. The majority of cells expressed low levels of α-synuclein (filled arrowheads) whereas 3–7% of TuJ1+ cells expressed a high level of protein (open arrowheads). Scale bar, 100 μm upper panels, 400 μm lower panels.
Figure 5. Gene expression profiling finds that the triplication genes are significantly enriched in AST iPSC-derived neurons.
Principle components analysis (a) and hierarchical clustering (b) shows that iPSCs cluster with hESCs, while fibroblasts and neurons cluster separately. There is no clear separation between AST and NAS-derived cells at this level of analysis. (c) Scatter plots demonstrate that global gene expression of iPSCs is more similar to hESCs than fibroblasts and there are no significant differences in global gene expression between AST and NAS iPSCs. (d) Multiple views of a three-dimensional PCA plot, following batch effect removal, comparing iPSC gene expression to all hESC data sets on the Affymetrix U133 Plus 2.0 platform that are publicly available (59 samples from 8 separate submissions). The iPSCs intermingle within the hESC landscape in all three dimensions. (e) Gene set enrichment analysis for the triplication genes shows significant enrichment in AST iPSCs (nominal _P_-value <0.05) and neurons (nominal _P_-value <0.0001) but not fibroblasts (nominal _P_-value=0.09). Enrichment score _P_-values are estimated by using an empirical gene set-based permutation test procedure. (f) SNCA expression is higher in AST-derived iPSCs and neurons than in equivalent cells from NAS.
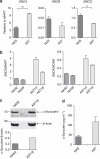
Figure 6. SNCA expression is doubled in selected iPSC lines when controlling for efficiency of neuralization.
(a) RT–PCR data for SNCA, SNCB and SNCG shows that expression of SNCA is significantly higher, and SNCG significantly lower, in AST iPSC-derived neurons when efficiency of neuralization is controlled for, by normalizing to expression of the pan-neuronal marker MAPT. Error bars represent standard deviation of technical replicates, _n_=3. ***P<0.0005; **P<0.005 (Student's _t_-test, unpaired, two-tailed). (b) Quantitative RT–PCR analysis of SNCA expression, normalized to pan-neuronal markers (NCAM, MAPT) to directly control for efficiency of differentiation, shows a twofold or greater increase in SNCA expression in neurons derived from AST iPSCs. Error bars represent standard deviation of technical replicates, _n_=3. (c) Western blot analysis of Day 20 neuronal cultures showed that AST18 expressed double the amount of α-synuclein protein as NAS2, despite differentiating into neurons with the same efficiency. (d) ELISA detects significantly more α-synuclein in 48 h conditioned media from AST neuronal cultures than equivalently conditioned media from NAS neuronal cultures. Error bars represent standard deviation of biological replicates, _n_=2.
Comment in
- Parkinson disease: Induced pluripotent stem cells-a new in vitro model to investigate α-synuclein dysfunction in Parkinson disease.
Malpass K. Malpass K. Nat Rev Neurol. 2011 Sep 20;7(10):536. doi: 10.1038/nrneurol.2011.144. Nat Rev Neurol. 2011. PMID: 21931347 No abstract available. - Pluripotent stem cells with triplication of alpha-synuclein locus.
Ozawa T. Ozawa T. Mov Disord. 2011 Dec;26(14):2480. doi: 10.1002/mds.24056. Mov Disord. 2011. PMID: 22332244 No abstract available.
References
- Jankovic J. Parkinson?s disease: clinical features and diagnosis. J Neurol. Neurosurg. Psychiatry 79, 368–376 (2008). - PubMed
- Braak H. & Braak E. Pathoanatomy of Parkinson?s disease. J. Neurol. 247 (Suppl 2), II3–10 (2000). - PubMed
- Polymeropoulos M. H. et al.. Mutation in the alpha-synuclein gene identified in families with Parkinson′s disease. Science 276, 2045–2047 (1997). - PubMed
- Spillantini M. G. et al.. Alpha-synuclein in Lewy bodies. Nature 388, 839–840 (1997). - PubMed
Publication types
MeSH terms
Substances
Grants and funding
- G0802462/MRC_/Medical Research Council/United Kingdom
- K-0911/PUK_/Parkinson's UK/United Kingdom
- G-0907/PUK_/Parkinson's UK/United Kingdom
- G0701075/MRC_/Medical Research Council/United Kingdom
- G1001253/MRC_/Medical Research Council/United Kingdom
- F-0902/PUK_/Parkinson's UK/United Kingdom
- G-4046/PUK_/Parkinson's UK/United Kingdom
- 089698/WT_/Wellcome Trust/United Kingdom
- F-1002/PUK_/Parkinson's UK/United Kingdom
- BBS/E/R/00001627/BB_/Biotechnology and Biological Sciences Research Council/United Kingdom
- G108/638/MRC_/Medical Research Council/United Kingdom
- MC_G1000735/MRC_/Medical Research Council/United Kingdom
- BBS/E/R/00001601/BB_/Biotechnology and Biological Sciences Research Council/United Kingdom
- G0802760/MRC_/Medical Research Council/United Kingdom
LinkOut - more resources
Full Text Sources
Other Literature Sources
Medical
Molecular Biology Databases
Research Materials
Miscellaneous


