miR-155 inhibits expression of the MEF2A protein to repress skeletal muscle differentiation - PubMed (original) (raw)
miR-155 inhibits expression of the MEF2A protein to repress skeletal muscle differentiation
Hee Young Seok et al. J Biol Chem. 2011.
Abstract
microRNAs (miRNAs) are 21-23-nucleotide non-coding RNAs. It has become more and more evident that this class of small RNAs plays critical roles in the regulation of gene expression at the post-transcriptional level. MEF2A is a member of the MEF2 (myogenic enhancer factor 2) family of transcription factors. Prior report showed that the 3'-untranslated region (3'-UTR) of the Mef2A gene mediated its repression; however, the molecular mechanism underlying this intriguing observation was unknown. Here, we report that MEF2A is repressed by miRNAs. We identify miR-155 as one of the primary miRNAs that significantly represses the expression of MEF2A. We show that knockdown of the Mef2A gene by siRNA impairs myoblast differentiation. Similarly, overexpression of miR-155 leads to the repression of endogenous MEF2A expression and the inhibition of myoblast differentiation. Most importantly, reintroduction of MEF2A in miR-155 overexpressed myoblasts was able to partially rescue the miR-155-induced myoblast differentiation defect. Our data therefore establish miR-155 as an important regulator of MEF2A expression and uncover its function in muscle gene expression and myogenic differentiation.
Figures
FIGURE 1.
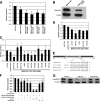
The 3′-UTR of the Mef2A gene mediates its repression. A, luciferase reporters containing the 3′-UTRs of the mouse Mef2A gene were transfected into the 293T cells, and luciferase activity was measured 48 h later. Results were presented as relative luciferase activity in which the control was assigned a value of 1. The pGL-3-luciferase and the β-globin-3′-UTR-luciferase reporters were used to serve as controls. Data represent the mean + S.D. from at least three independent experiments in triplicate. *, p < 0.05. B, equal amount of FLAG-tagged MEF2A expression plasmids, which contains or does not contain its 3′-UTR were transfected into 293T cells. Protein expression level was measured by Western blot. β-Tubulin was used as a loading control. C, a luciferase reporter directed by the full-length MEF2A-3′-UTR(1834–2898) was co-transfected with indicated miRNA expression plasmids into the 293T cells, and luciferase activity was measured 48 h later. Results were presented as relative luciferase activity in which the control was assigned a value of 1. The pGL-3-luciferase (control) and the β-globin-3′-UTR-luciferase reporters were used to serve as controls. Data represent the mean + S.D. from at least three independent experiments in duplicate. *, p < 0.05. D, a luciferase reporter directed by a short MEF2A-3′-UTR(2251–2679) was co-transfected with indicated miRNA expression plasmids into the 293T cells, and luciferase activity was measured 48 h later. Results were presented as relative luciferase activity in which the control was assigned a value of 1. The pGL-3-luciferase and the β-globin-3′-UTR-luciferase reporters were used to serve as controls. Data represent the mean + S.D. from at least three independent experiments in duplicate. *, p < 0.05. E, schematic diagram of the mouse Mef2A 3′-UTR and the sequence alignment with miR-155. F, luciferase reporters containing the 3′-UTRs of the mouse Mef2A gene (full-length nt 1834–2898 or the short form nt 2251–2679) were co-transfected with increasing amount of miR-155 or a mutant miR-155 (miR-155-mut) into the 293T cells, and luciferase activity was measured 48 h later. Results were presented as relative luciferase activity in which the control was assigned a value of 1. The β-globin-3′-UTR-luciferase reporter was used to serve as controls. Data represent the mean + S.D. from at least three independent experiments in triplicate. *, p < 0.05. G, FLAG-tagged MEF2A expression plasmids, which contain its 3′-UTR, were co-transfected with miR-155 or a mutant miR-155 into 293T cells. Protein expression level was measured by Western blot using an anti-FLAG antibody. β-Tubulin was used as a loading control.
FIGURE 2.
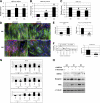
Knockdown of MEF2A impairs myoblast differentiation. A, quantitative real-time PCR measurement of Mef2A transcript expression during C2C12 myoblast differentiation at indicated dates. The result was presented as relative expression level in which the control was assigned a value of 1. Data represent the mean + S.D. from at least three independent experiments. *, p < 0.05. G0, growth medium day 0; D1, differentiation medium day 1; D3, differentiation medium day 3. B, quantitative measurement of MEF2A protein expression during C2C12 myoblast differentiation at indicated dates. Results from Western blots were quantified by densitometry measurement and presented as relative expression level in which the control was assigned a value of 1. Data represent the mean + S.D. from at least three independent experiments. *, p < 0.05. C, quantitative Taqman PCR measurement of mature miR-155 expression during C2C12 myoblast differentiation at indicated dates. Result was presented as relative expression level in which the control was assigned a value of 1. Data represent the mean + S.D. from at least three independent experiments. *, p < 0.05. D, immunohistology of C2C12 cells treated with either control or MEF2A-specific siRNAs. Cells were induced to differentiate at different time courses (differentiation day 1 or day 3) and were stained with antibodies that recognize striate muscle MHC (green) and myogenin (red). DAPI stains nuclei. DM1, differentiation medium day 1; DM3, differentiation medium day 3. E, quantitative analyses of cell numbers of myoblast (MHC-positive, single nucleus) and myotubes (MHC-positive, three or more nuclei) in siMEF2A-treated C2C12 cells when compared with control siRNA treatment. Data represent the mean + S.D. from at least three independent experiments. *, p < 0.05. F, quantitative analyses of cell size of myoblast and myotubes in siMEF2A-treated C2C12 cells when compared with control siRNA treatment. Left panel, distribution of myoblast and myotube size. Right panel, average size of myoblast and myotube size. Data represent the mean + S.D. from at least three independent experiments. *, p < 0.05. G, quantitative real-time PCR analyses of gene expression in siMEF2A-treated C2C12 myoblasts and myotubes. Result was presented as relative expression level in which the control was assigned a value of 1. Data represent the mean + S.D. from at least three independent experiments. *, p < 0.05. H, Western blot analyses of protein expression in siMEF2A-treated C2C12 myoblasts and myotubes, using antibodies recognize indicated proteins.
FIGURE 3.
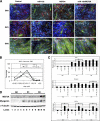
MEF2A is repressed by miR-155 via its 3′-UTR. A, immunohistology of C2C12 cells treated with either control or miR-155. Cells were induced to differentiate at indicated dates and were stained with antibodies that recognize striate muscle MHC (green) and myogenin (red). DAPI stains nuclei. DM1, differentiation medium day 1; DM3, differentiation medium day 3. B, quantitative analyses of cell numbers of myoblast (MHC-positive, single nucleus) and myotubes (MHC-positive, three or more nuclei) in miR-155 overexpressed C2C12 cells when compared with control miRNA treatment. Data represent the mean + S.D. from at least three independent experiments. *, p < 0.05. C, quantitative analyses of cell size of myoblast and myotubes in miR-155 overexpressed C2C12 cells when compared with control miRNA treatment. Left panel, distribution of myoblast and myotube size. Right panel, average size of myoblast and myotube size. Data represent the mean + S.D. from at least three independent experiments. *, p < 0.05. D, quantitative real-time PCR analyses of gene expression in miR-155 overexpressed C2C12 myoblasts and myotubes. Result was presented as relative expression level in which the control was assigned a value of 1. Data represent the mean + S.D. from at least three independent experiments. *, p < 0.05. ACTA, skeletal muscle α-actin; G0, growth medium day 0; D1, differentiation medium day 1; D3, differentiation medium day 3. E, quantitative measurement of protein expression in miR-155 overexpressed C2C12 myoblasts, using antibodies recognize indicated proteins. Results from Western blots were quantified by densitometry measurement and presented as relative expression level in which the control was assigned a value of 1. Data represent the mean + S.D. from at least three independent experiments. *, p < 0.05.
FIGURE 4.
miR-155 inhibits myoblast differentiation which is suppresses by MEF2A. A, immunohistology of C2C12 cells treated with control, miR-155, Ad-MEF2A, or both miR-155 and Ad-MEF2A. Cells were induced to differentiate at indicated dates and were stained with antibodies that recognize striate muscle MHC (green) and myogenin (red). DAPI stains nuclei. GM1, growth medium day 1; DM1, differentiation medium day 1; DM3, differentiation medium day 3. B, quantitative analyses of cell size of MHC positive myoblast and myotubes in C2C12 cells treated with control, miR-155, MEF2A, or both miR-155 and MEF2A. The distribution of myoblast and myotube size was presented as percentage. C, quantitative real-time PCR analyses of gene expression in C2C12 cells treated with control, miR-155, MEF2A, or both miR-155 and MEF2A. Result was presented as relative expression level in which the control was assigned a value of 1. Data represent the mean + S.D. from at least three independent experiments. *, p < 0.05. G0, growth medium day 0; D1, differentiation medium day 1; D3, differentiation medium day 3. D, Western blot analyses of protein expression levels in C2C12 cells treated with control (contl), miR-155, MEF2A, or both miR-155 and MEF2A. D2, differentiation medium day 2.
Similar articles
- MEF2A Regulates the MEG3-DIO3 miRNA Mega Cluster-Targeted PP2A Signaling in Bovine Skeletal Myoblast Differentiation.
Wang Y, Mei C, Su X, Wang H, Yang W, Zan L. Wang Y, et al. Int J Mol Sci. 2019 Jun 4;20(11):2748. doi: 10.3390/ijms20112748. Int J Mol Sci. 2019. PMID: 31167510 Free PMC article. - MEF2A regulates the Gtl2-Dio3 microRNA mega-cluster to modulate WNT signaling in skeletal muscle regeneration.
Snyder CM, Rice AL, Estrella NL, Held A, Kandarian SC, Naya FJ. Snyder CM, et al. Development. 2013 Jan 1;140(1):31-42. doi: 10.1242/dev.081851. Epub 2012 Nov 15. Development. 2013. PMID: 23154418 Free PMC article. - MicroRNA-148a promotes myogenic differentiation by targeting the ROCK1 gene.
Zhang J, Ying ZZ, Tang ZL, Long LQ, Li K. Zhang J, et al. J Biol Chem. 2012 Jun 15;287(25):21093-101. doi: 10.1074/jbc.M111.330381. Epub 2012 Apr 30. J Biol Chem. 2012. PMID: 22547064 Free PMC article. - Effects of microRNAs on skeletal muscle development.
Wang J, Yang LZ, Zhang JS, Gong JX, Wang YH, Zhang CL, Chen H, Fang XT. Wang J, et al. Gene. 2018 Aug 20;668:107-113. doi: 10.1016/j.gene.2018.05.039. Epub 2018 May 25. Gene. 2018. PMID: 29775754 Review. - Non-coding RNAs in muscle differentiation and musculoskeletal disease.
Ballarino M, Morlando M, Fatica A, Bozzoni I. Ballarino M, et al. J Clin Invest. 2016 Jun 1;126(6):2021-30. doi: 10.1172/JCI84419. Epub 2016 Jun 1. J Clin Invest. 2016. PMID: 27249675 Free PMC article. Review.
Cited by
- The role of microRNAs in skeletal muscle health and disease.
Kirby TJ, Chaillou T, McCarthy JJ. Kirby TJ, et al. Front Biosci (Landmark Ed). 2015 Jan 1;20(1):37-77. doi: 10.2741/4298. Front Biosci (Landmark Ed). 2015. PMID: 25553440 Free PMC article. Review. - Regulation of microRNAs in Satellite Cell Renewal, Muscle Function, Sarcopenia and the Role of Exercise.
Fochi S, Giuriato G, De Simone T, Gomez-Lira M, Tamburin S, Del Piccolo L, Schena F, Venturelli M, Romanelli MG. Fochi S, et al. Int J Mol Sci. 2020 Sep 14;21(18):6732. doi: 10.3390/ijms21186732. Int J Mol Sci. 2020. PMID: 32937893 Free PMC article. Review. - MEF2 transcription factors regulate distinct gene programs in mammalian skeletal muscle differentiation.
Estrella NL, Desjardins CA, Nocco SE, Clark AL, Maksimenko Y, Naya FJ. Estrella NL, et al. J Biol Chem. 2015 Jan 9;290(2):1256-68. doi: 10.1074/jbc.M114.589838. Epub 2014 Nov 21. J Biol Chem. 2015. PMID: 25416778 Free PMC article. - Osteoglycin inhibition by microRNA miR-155 impairs myogenesis.
Freire PP, Cury SS, de Oliveira G, Fernandez GJ, Moraes LN, da Silva Duran BO, Ferreira JH, Fuziwara CS, Kimura ET, Dal-Pai-Silva M, Carvalho RF. Freire PP, et al. PLoS One. 2017 Nov 21;12(11):e0188464. doi: 10.1371/journal.pone.0188464. eCollection 2017. PLoS One. 2017. PMID: 29161332 Free PMC article. - microRNA-mRNA Profile of Skeletal Muscle Differentiation and Relevance to Congenital Myotonic Dystrophy.
Morton SU, Sefton CR, Zhang H, Dai M, Turner DL, Uhler MD, Agrawal PB. Morton SU, et al. Int J Mol Sci. 2021 Mar 7;22(5):2692. doi: 10.3390/ijms22052692. Int J Mol Sci. 2021. PMID: 33799993 Free PMC article.
References
- Weintraub H., Davis R., Tapscott S., Thayer M., Krause M., Benezra R., Blackwell T. K., Turner D., Rupp R., Hollenberg S. (1991) Science 251, 761–766 - PubMed
- Arnold H. H., Winter B. (1998) Curr. Opin. Genet. Dev. 8, 539–544 - PubMed
- Molkentin J. D., Olson E. N. (1996) Curr. Opin. Genet. Dev. 6, 445–453 - PubMed
- Tapscott S. J. (2005) Development 132, 2685–2695 - PubMed
- Molkentin J. D., Black B. L., Martin J. F., Olson E. N. (1995) Cell 83, 1125–1136 - PubMed
Publication types
MeSH terms
Substances
LinkOut - more resources
Full Text Sources
Other Literature Sources


