The IAP-antagonist ARTS initiates caspase activation upstream of cytochrome C and SMAC/Diablo - PubMed (original) (raw)
The IAP-antagonist ARTS initiates caspase activation upstream of cytochrome C and SMAC/Diablo
N Edison et al. Cell Death Differ. 2012 Feb.
Abstract
ARTS (Sept4_i2) is a pro-apoptotic tumor suppressor protein that functions as an antagonist of X-linked IAP (XIAP) to promote apoptosis. It is generally thought that mitochondrial outer membrane permeabilization (MOMP) occurs before activation of caspases and is required for it. Here, we show that ARTS initiates caspase activation upstream of MOMP. In living cells, ARTS is localized to the mitochondrial outer membrane. In response to apoptotic signals, ARTS translocates rapidly to the cytosol in a caspase-independent manner, where it binds XIAP and promotes caspase activation. This translocation precedes the release of cytochrome C and SMAC/Diablo, and ARTS function is required for the normal timing of MOMP. We also show that ARTS-induced caspase activation leads to cleavage of the pro-apoptotic Bcl-2 family protein Bid, known to promote MOMP. We propose that translocation of ARTS initiates a first wave of caspase activation that can promote MOMP. This leads to the subsequent release of additional mitochondrial factors, including cytochrome C and SMAC/Diablo, which then amplifies the caspase cascade and causes apoptosis.
Figures
Figure 1
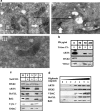
ARTS is localized to the MOM. (a) EM localization of ARTS. TEM images of ARTS immunogold labeling in COS-7 cells. Endogenous ARTS (I – left panel, Bar – 500 nm) and exogenous ARTS (II – right panel, Bar – 200 nm) are shown at the outer membrane of the mitochondria (white arrows). Staining using only secondary antibody was used as negative control (III, Bar – 200 nm). (b) PK treatment of mitochondria shows that ARTS is located at the MOM. Purified mitochondria from COS-7 cells transfected with 6Myc-ARTS were treated with increased concentrations of PK and analyzed using SDS-PAGE and western blot analysis. ARTS levels were decreased upon treatment with elevated concentrations of PK, similar to VDAC, a well-known MOM integral protein. In contrast, Hexokinase I (HXKI) (an outer membrane-associated protein) was completely digested by PK. Upon treatment with 1% Triton, which solubilizes mitochondrial membranes, all proteins examined were digested by the smallest PK concentration. (c) ARTS is tightly associated with the MOM. COS-7 cells were transiently transfected with 6Myc-ARTS. Fractions enriched for mitochondria were treated with sodium carbonate (Na2CO3) pH 11.5 or mock treated with sucrose. The whole untreated mitochondrial fraction (M), supernatant (S) and pellet (P) fractions were analyzed by immunoblotting. In contrast to HXKI, whose association with the MOM is interrupted by the carbonate treatment (found in the supernatant), ARTS was not detected in the supernatant fraction, similarly to Bcl-2 and Bcl-XL. This suggests that ARTS behaves like an integral MOM protein, similar to Bcl-2 and Bcl-XL. CytoC and SMAC, which reside in the IMS, are released to the supernatant fraction during alkaline treatment. (d) ARTS behaves similar to MOM proteins in response to treatment with digitonin. Fractions enriched for mitochondria were obtained from COS-7 cells transfected with 6Myc-ARTS and incubated with the indicated concentrations of digitonin. Following centrifugation, the supernatant fraction was subjected to SDS-PAGE and western blot analyses. All shown proteins were not present in the supernatant fraction in the absence of digitonin. Translocation of ARTS from the mitochondrial pellet into the supernatant follows a similar pattern as seen for other integral MOM proteins, such as Bcl-2, Bcl-XL and VDAC
Figure 2
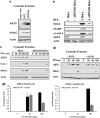
The translocation of ARTS from mitochondria precedes the release of cytoC and SMAC. (a) Overexpression of ARTS promotes the release of SMAC from mitochondria. Cellular fractionation assay performed on COS-7 cells transfected with AU5-ARTS and a mutant ARTS lacking its first 4aa (ARTSD4aa). Western blot analysis of the cytosolic fraction was conducted using the indicated antibodies. ARTS overexpression promotes the release of SMAC from mitochondria to the cytosol. (b) Knockdown of ARTS in HeLa cells caused resistance to STS-induced apoptosis. ARTS KD HeLa cells and control HeLa cells were incubated with STS 1.75 _μ_M for 3 h. Cells were lysed and analyzed by western blot with the indicated antibodies. ARTS KD HeLa cells are protected against STS-induced apoptosis, exhibiting significant reduction in the levels of three different apoptotic markers: H2AX, cleaved PARP (cPARP) and cCASP 9. (c) The translocation of endogenous ARTS from mitochondria precedes the release of endogenous cytoC and SMAC in HeLa cells and requires for it. Cellular fractionation assays were performed on HeLa and ARTS KD HeLa cells. Cells were treated with 1.75 _μ_M STS for increasing periods of time and western blot analysis of the cytosolic fraction was conducted using the indicated antibodies. The translocation of endogenous ARTS from mitochondria to the cytosol was seen after 30 min following STS induction. This precedes the release of SMAC and cytoC, which was detected in the cytosol only after 3 h of STS induction. In ARTS KD HeLa cells, SMAC and cytoC were seen in the cytosol after 6 h of STS induction, suggesting that ARTS is required for proper release of cytoC and SMAC from the mitochondria. (d) The early translocation of endogenous ARTS from the mitochondria to the cytosol of HeLa cells occurs in a caspase-independent manner. (dI) Cell fractionation assays were performed on HeLa cells. Cells were treated with 1.75 _μ_M STS for increasing periods of time in the presence or absence of the pan-caspase inhibitor Q-VD. Western blot analysis of the cytosolic fraction was conducted with the indicated antibodies. The early translocation of endogenous ARTS from the mitochondria to the cytosol of HeLa cells (detected after 30 min) preceded the release of SMAC and cytoC (detected after 180 min) and was not inhibited by Q-VD. Treatment with Q-VD affected the cytosolic levels of ARTS and SMAC only after 3 h of STS treatment. (dII) Densitometry analyses of data shown in (dI) and repeating experiments demonstrating the levels of ARTS or SMAC in the cytosolic fraction of HeLa cells with or without the caspase inhibitor Q-VD. Measurements are presented relative to actin levels which served as loading controls
Figure 3
The translocation of ARTS from mitochondria precedes the release of SMAC. (a) The translocation of mCherry-ARTS from mitochondria precedes the release of mCherry-SMAC in HeLa cells. HeLa cells were transfected with mCherry-ARTS or mCherry-SMAC. Cells were treated with 1.75 _μ_M STS for the indicated time periods. Arrows indicate cytosolic staining pattern. Nuclei were stained blue with DAPI staining. ARTS loses its bright mitochondrial staining pattern and acquires a diffuse faint cytosolic staining as early as 15 min after STS treatment. In contrast, SMAC maintains its bright mitochondrial staining and exhibits a diffuse cytosolic pattern only after 3 h of STS induction. Thus, the translocation of mCherry-ARTS from the mitochondria to the cytosol (after 15 min) precedes the release of mCherry-SMAC (seen only after 180 min). (b) Downregulation of ARTS with shRNA in HeLa cells (‘ARTS KD HeLa') inhibits the release of SMAC into the cytosol. ARTS KD HeLa cells were transfected with mCherry-SMAC. Cells were treated with 1.75 _μ_M STS for the indicated time periods. Nuclear morphology was evaluated by DAPI staining. SMAC retained its bright mitochondrial pattern of staining in these ARTS KD cells, even after 3 h following STS treatment. These data suggest that ARTS is required for the efficient release of SMAC. (c) The translocation of ARTS from mitochondria to cytosol precedes the release of SMAC in transfected HeLa cells. HeLa cells were co-transfected with AU5-ARTS and flag-SMAC. Cells were also stained with mitotracker (red), and incubated with anti-ARTS (blue) and anti-SMAC (green) antibodies. The panel shows representative images from each time point (Bar – 10 _μ_m). ARTS loses its colocalization with mitotracker and acquires a diffuse faint cytosolic staining as early as 15 min after STS treatment. In contrast, SMAC remains colocalized with mitotracker at time points 15, 30 and 60 min, and exhibits diffuse cytosolic pattern only after 3 h of STS induction. Thus, the translocation of ARTS from the mitochondria to the cytosol precedes the release of SMAC. (d) Quantification of the cellular localization of ARTS and SMAC. To quantify the number of cells with cytosolic versus mitochondrial localization of ARTS and SMAC, cells were transfected and IF double labeling was performed. The graphs represent the numbers of cells displaying cytoplasmic/mitochondrial staining as a percent of total counted cells (mean±S.E., _n_=300). Due to the transfection, there were always cells undergoing apoptosis, causing background for both ARTS and SMAC already at time 0. However, a significant increase in the proportion of cells with cytoplasmic staining and corresponding loss of mitochondrial localization of ARTS was repeatedly seen as soon as 15 min after STS induction. These results confirm our western blot data that translocation of ARTS to the cytosol precedes that of SMAC
Figure 4
The translocation of endogenous ARTS from mitochondria precedes the release of endogenous SMAC in HeLa cells stably transfected with cyto C-GFP. (a and b) IF assays were performed on HeLa cells stably transfected with cytoC-GFP. Endogenous SMAC (a, red label) exhibited a loss of its condensed mitochondrial colocalization with cytoC-GFP (green) only after 3 h of STS treatment. In contrast, endogenous ARTS (b, red label) showed a loss of its mitochondrial colocalization with cytoC-GFP after as early as 15 min of STS treatment. White arrows in (b) mark cells in which cytoC-GFP is still displaying mitochondrial, condensed staining while ARTS has already translocated to the cytosol. Although some cells showed a release of cytoC-GFP after 1 h, most of the cells showed cytosolic diffused staining only after 3 h
Figure 5
An ARTS-XIAP complex forms rapidly in response to apoptotic stimuli (BiFC assay). HeLa cells were transiently transfected with ARTS and XIAP fused to parts of Venus fluorescent protein (VN 1–173 and VC 1–155, respectively); pdsRED plasmid was used as a transfection efficiency marker. Apoptosis was induced with STS treatment and the fluorescent signal indicating the ARTS-XIAP proximity was measured by IF (a) and flow cytometric analyses of single-cell suspensions (b). (a) Cells assayed by IF were visualized by confocal microscopy (Zeiss LSM 510). (b) FACS results were normalized to the readings of transfection efficiency reporter (pdsRED) relative to _t_=0. The values represent mean values+S.E. of three independent experiments. The Y axis represents the ratio between YFP fluorescence (reflecting binding of ARTS to XIAP) and the red fluorescence (marking the transfected cells) relatively to _t_=0. This ratio was calculated for each time point. Both IF and FACS analysis agree that fluorescence indicative of ARTS-XIAP complex formation can be observed as early as 15 min after STS treatment and that the fluorescent signal continues to increase and peaks at 60 min after STS induction
Figure 6
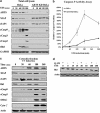
ARTS is required for early downregulation of XIAP, proper activation of caspases-9, 3 and 2 and truncation Bid. (a) Reduction in XIAP levels, activation of caspase-9 (cCASP9) and truncation of Bid are seen in HeLa cells 30–60 min after STS treatment, but not in ARTS KD HeLa cells. Thirty minutes after STS induction, XIAP but not cIAP1 levels were decreased. After 3 h, XIAP and cIAP1 levels were severely reduced. Processing of caspase-9 is seen already after 30 min of STS induction. tBid is seen 60 min after STS induction. Importantly, knockdown of ARTS blocked the decrease of XIAP as well as truncation of Bid and significantly inhibited the activation of caspase-9, 3 and 2. *Indicates a non-specific band. (b) Caspase-9 activation is significantly compromised in ARTS KD HeLa cells. The cleavage of fluorescently labeled substrate of caspase-9 (Caspase-9 Fluorometric Assay Kit, BioVision, K118), caspase-9 activity assay revealed activation of caspase-9 as early as 60 min after STS treatment in HeLa cells with a peak of activity (5-fold increase) shown 180 min after apoptotic induction. Significant inhibition of caspase-9 activity is seen in ARTS KD HeLa cells. (c) Translocation of ARTS precedes the release of CytoC and SMAC following UV-induced apoptosis. Cells were irradiated with UV and the levels of various apoptotic proteins were measured after increasing periods of time. The levels of XIAP, cIAP1, Bid, cleaved caspase-9 (cCASP 9), cleaved caspase-3 (cCASP 3), SMAC and cytoC were analyzed using western blot analysis. An early decrease in XIAP, but not in cIAP1 levels was seen 30 min after UV induction. A second phase of protein downregulation was observed 6 h after UV irradiation. At this time period, cIAP1 levels as well as those of XIAP and Bid were severely reduced. (d) Bid levels are reduced as early as 15–30 min after STS treatment. HeLa cells were treated with 1.75 _μ_M STS for increasing periods of time in the presence or absence of the pan-caspase inhibitor Q-VD. Western blot analysis revealed that the early reduction in Bid levels occurring 15–30 min after STS treatment is blocked by caspase inhibitors. Thus, the observed reduction in Bid levels seems to occur as a result of caspase cleavage
Figure 7
Inactivation of ARTS in HeLa cells leads to resistance toward apoptosis. (a) Knockdown of ARTS in HeLa cells results in increased viability of cells following STS induction-XTT results. Cell viability was quantified using XTT-based assay (for details, see Materials and Methods). ARTS KD HeLa cells showed a significant increase in cell survival compared with HeLa controls in response to STS (mean±S.E., _n_=4). (b) Knockdown of ARTS in HeLa cells results in increased viability of cells following STS induction counting of DAPI-stained number of cells. Quantification analysis of the cell survival after STS induction in HeLa versus ARTS KD HeLa cells was performed. Survival rates were determined by number of cells stained with DAPI. Cell survival numbers are composed of average cell counts of eight different fields for each sample using fluorescence microscope. The results showed higher numbers of ARTS knockdown cells at the various time points following STS treatment. (c) Knockdown of ARTS increases clonogenic survival. Apoptosis was induced in HeLa and ARTS KD HeLa cells by 1.75 _μ_M STS for 1 h. Cells were washed and 300 cells of each group were seeded into 6 mm dishes and allowed to grow for 12 days. Colonies >50 cells were counted. The graph shows the relative number of colonies after apoptotic induction. (d) Knockdown of ARTS in HeLa cells results in increased viability of cells following STS induction-TUNEL assay. Apoptosis rate was measured by percent of TUNEL-positive cells out of total number of cells after STS induction relatively to time 0 (mean±S.E., _n_=3). Altogether, results obtained using four different cell death assessing methods suggest that inactivation of ARTS in HeLa cells leads to resistance toward apoptosis. These data support our hypothesis that early activation of caspases induced by ARTS promotes cell death
Figure 8
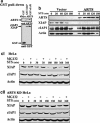
ARTS promotes rapid and specific degradation of XIAP but not of cIAP1 protein upon induction of apoptosis. (a) ARTS binds to both XIAP and cIAP1. COS-7 cells were transiently transfected with pSC2-6myc-ARTS construct together with mammalian GST-XIAP, GST-cIAP1 or GST vector (pEBG) alone as a control. The cells were treated with STS for 1 h and GST pull-down was carried out, followed by western blot analysis with anti-GST and anti-ARTS antibodies. ARTS binds to both cIAP1 and XIAP. (b) High levels of ARTS alone cause downregulation of XIAP levels, but not of cIAP1. COS-7 cells were transiently transfected with pSC2-6myc-ARTS construct. The cells were treated with 1.75 _μ_M STS for increasing periods of time. Western blot analysis was carried out using the indicated antibodies. High levels of ARTS alone cause downregulation of XIAP levels, but not of cIAP1. (c) ARTS induces degradation of XIAP by the UPS. (cI) XIAP and cIAP1 endogenous protein levels were evaluated by western blot analysis of lysates from HeLa cells following different incubation times with STS. XIAP protein steady-state levels began to decrease 30 min after STS induction, and this decrease continued for several hours. In contrast, no detectable change in cIAP1 protein steady-state levels was seen over the next 3-h time course. Moreover, incubation of the cells with the proteasome inhibitor MG132 (20 _μ_M for 6 h) blocked most of the decline of XIAP protein. Thus, XIAP is degraded by the UPS in cells stimulated to undergo apoptosis. (cII) ARTS is required for the rapid, early reduction of XIAP in response to STS treatment. XIAP and cIAP1 protein levels were determined using western blot analysis in ARTS KD HeLa cells treated with STS. Knockdown of ARTS blocked the decrease of XIAP protein almost as well as MG132. This suggests that ARTS is required for the rapid, early reduction of XIAP in response to STS treatment
Figure 9
Model for the role of ARTS in initiating caspase activation and apoptosis. In living cells, low levels of ARTS-XIAP complexes form and contribute to XIAP turnover. Upon pro-apoptotic signals, ARTS translocates from the MOM to the cytosol and complex formation with XIAP dramatically increases. This causes a reduction of XIAP levels due to a combined of UPS-mediated degradation and caspase cleavage. This early reduction of XIAP triggers an initial, non-lethal wave of caspase activation (Phase I – Initiation phase). This initial caspase activity leads to the cleavage of Bid and presumably other factors that promote MOMP. Upon MOMP additional pro-apoptotic factors, including cytoC and SMAC are released together with more mitochondrial ARTS. Our model predicts that this subsequent release of ARTS, together with cytoC and SMAC, triggers a second and amplified wave of caspase activation which brings about the final destruction of the cell (Phase II – Amplification phase)
Similar articles
- ARTS binds to a distinct domain in XIAP-BIR3 and promotes apoptosis by a mechanism that is different from other IAP-antagonists.
Bornstein B, Gottfried Y, Edison N, Shekhtman A, Lev T, Glaser F, Larisch S. Bornstein B, et al. Apoptosis. 2011 Sep;16(9):869-81. doi: 10.1007/s10495-011-0622-0. Apoptosis. 2011. PMID: 21695558 - Fas death receptor signalling: roles of Bid and XIAP.
Kaufmann T, Strasser A, Jost PJ. Kaufmann T, et al. Cell Death Differ. 2012 Jan;19(1):42-50. doi: 10.1038/cdd.2011.121. Epub 2011 Sep 30. Cell Death Differ. 2012. PMID: 21959933 Free PMC article. Review. - Signaling of cell death and cell survival following focal cerebral ischemia: life and death struggle in the penumbra.
Ferrer I, Planas AM. Ferrer I, et al. J Neuropathol Exp Neurol. 2003 Apr;62(4):329-39. doi: 10.1093/jnen/62.4.329. J Neuropathol Exp Neurol. 2003. PMID: 12722825 Review.
Cited by
- Sept4/ARTS regulates stem cell apoptosis and skin regeneration.
Fuchs Y, Brown S, Gorenc T, Rodriguez J, Fuchs E, Steller H. Fuchs Y, et al. Science. 2013 Jul 19;341(6143):286-9. doi: 10.1126/science.1233029. Epub 2013 Jun 20. Science. 2013. PMID: 23788729 Free PMC article. - Live to die another way: modes of programmed cell death and the signals emanating from dying cells.
Fuchs Y, Steller H. Fuchs Y, et al. Nat Rev Mol Cell Biol. 2015 Jun;16(6):329-44. doi: 10.1038/nrm3999. Epub 2015 May 20. Nat Rev Mol Cell Biol. 2015. PMID: 25991373 Free PMC article. Review. - Role of WW domain E3 ubiquitin protein ligase 2 in modulating ubiquitination and Degradation of Septin4 in oxidative stress endothelial injury.
Zhang N, Zhang Y, Wu B, You S, Sun Y. Zhang N, et al. Redox Biol. 2020 Feb;30:101419. doi: 10.1016/j.redox.2019.101419. Epub 2020 Jan 2. Redox Biol. 2020. PMID: 31924572 Free PMC article. - A small-molecule ARTS mimetic promotes apoptosis through degradation of both XIAP and Bcl-2.
Mamriev D, Abbas R, Klingler FM, Kagan J, Kfir N, Donald A, Weidenfeld K, Sheppard DW, Barkan D, Larisch S. Mamriev D, et al. Cell Death Dis. 2020 Jun 25;11(6):483. doi: 10.1038/s41419-020-2670-2. Cell Death Dis. 2020. PMID: 32587235 Free PMC article. - Parkin promotes degradation of the mitochondrial pro-apoptotic ARTS protein.
Kemeny S, Dery D, Loboda Y, Rovner M, Lev T, Zuri D, Finberg JP, Larisch S. Kemeny S, et al. PLoS One. 2012;7(7):e38837. doi: 10.1371/journal.pone.0038837. Epub 2012 Jul 9. PLoS One. 2012. PMID: 22792159 Free PMC article.
References
- Shi Y. Mechanisms of caspase activation and inhibition during apoptosis. Mol Cell. 2002;9:459–470. - PubMed
- Green DR, Kroemer G. The pathophysiology of mitochondrial cell death. Science. 2004;305:626–629. - PubMed
- Salvesen GS, Duckett CS. IAP proteins: blocking the road to death's door. Nat Rev Mol Cell Biol. 2002;3:401–410. - PubMed
Publication types
MeSH terms
Substances
LinkOut - more resources
Full Text Sources
Other Literature Sources
Research Materials


