Sirtuin-3 (Sirt3) regulates skeletal muscle metabolism and insulin signaling via altered mitochondrial oxidation and reactive oxygen species production - PubMed (original) (raw)
Sirtuin-3 (Sirt3) regulates skeletal muscle metabolism and insulin signaling via altered mitochondrial oxidation and reactive oxygen species production
Enxuan Jing et al. Proc Natl Acad Sci U S A. 2011.
Abstract
Sirt3 is a member of the sirtuin family of protein deacetylases that is localized in mitochondria and regulates mitochondrial function. Sirt3 expression in skeletal muscle is decreased in models of type 1 and type 2 diabetes and regulated by feeding, fasting, and caloric restriction. Sirt3 knockout mice exhibit decreased oxygen consumption and develop oxidative stress in skeletal muscle, leading to JNK activation and impaired insulin signaling. This effect is mimicked by knockdown of Sirt3 in cultured myoblasts, which exhibit reduced mitochondrial oxidation, increased reactive oxygen species, activation of JNK, increased serine and decreased tyrosine phosphorylation of IRS-1, and decreased insulin signaling. Thus, Sirt3 plays an important role in diabetes through regulation of mitochondrial oxidation, reactive oxygen species production, and insulin resistance in skeletal muscle.
Conflict of interest statement
The authors declare no conflict of interest.
Figures
Fig. 1.
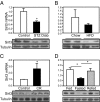
Sirt3 expression in different states of diabetes and aging. (A) Skeletal muscles from the hind limbs of STZ diabetic mice and controls (8-wk-old C57BL/6) were collected. RNA and protein was extracted and analyzed by either quantitative PCR or Western blotting. (B) Skeletal muscles from the hind limb of obese high fat diet (HFD) and control mice were collected and processed for quantitative PCR and Western blot analysis for Sirt3 expression. (C) Hind-limb skeletal muscle of CR mice along with controls was collected and processed for quantitative PCR and Western blot analysis. (D) Mice were either randomly fed or fasted for 24 h; half of the fasted animals were then refed for 16 h. After each treatment, quadriceps muscles from fed, fasted, and refed groups were collected and processed for detection of Sirt3 expression as above.
Fig. 2.
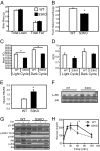
Sirt3 knockout mice have increased oxidative stress and insulin resistance in skeletal muscle accompanied by decreased respiration. (A) A DXA scan was performed using 16-wk-old male C57BL/6 WT and KO mice (n = 4), body composition was measured, and Student's t test was performed for significance. (B) CLAMS analysis was performed using 16-wk-old male C57BL/6 WT and KO mice. Daily food intake per mouse over 48 h of CLAMS study was calculated and Student's t test was performed for significance. (C) VO2 was recorded over 48 h and normalized for lean body mass calculated from the DXA scan. Dark cycle and light cycle VO2 were analyzed separately and Student's t tests were performed for significance. (D) Dark cycle and light cycle RERs were calculated using the ratio between VCO2 and VO2. (E) Skeletal muscle from hind limbs of 24-wk-old fasted WT and Sirt3 KO mice was collected, and 25 mg of muscle was homogenized (n = 5). TBARS assay was performed with skeletal muscle homogenates using a TBARS assay kit (Calbiochem Inc.). Student's t test was performed for significance. (F) Hind-limb skeletal muscle from fed 24-wk-old male WT and Sirt3 KO mice was collected and processed and then subjected to Western blot analysis for JNK phosphorylation and total protein levels. (G) In vivo insulin stimulations were performed on 24-wk-old male WT and Sirt3 knockout mice via vena cava injection. Hind-limb skeletal muscle was collected, processed, and subjected to Western blot analysis using the indicated antibodies. (H) For GTTs, blood glucose was measured by tail bleeding at 0, 15, 30, 60, and 120 min after injection (n = 5).
Fig. 3.
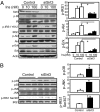
Effects of Sirt3 knockdown on insulin sensitivity and stress kinase activation. (A) C2C12 cells were transiently transfected with siRNA targeting Sirt3 or scrambled control. Two days after transfection, cells were serum-deprived for 4 h and then stimulated by addition of different concentrations of insulin for 5 min. Cell lysate was collected and subjected to Western blotting with different antibodies. Autoradiography of Western blots was quantified with ImageJ software. The Student's t tests were performed for significance using relative units to serum-starved control results (n = 3). (B) Sirt3 knockdown and control cells were grown to 70% confluence with low glucose (100 mg/dL glucose) DMEM containing 10% FBS. Lysates were collected and processed and then subjected to Western blotting for antibodies against phosphorylated IRS-1, JNK, and p38 MAP Kinase, as well as antibodies against total proteins. The autoradiography was quantified by ImageJ software, and a Student's t test was performed for significance using relative units from the quantification (n = 3).
Fig. 4.
Sirt3 knockdown C2C12 cells undergo stress response with elevated intracellular ROS production. (A) ROS levels of Sirt3 knockdown and control cells were determined using CM-H2DCFDA (Molecular Probes). (B) After incubation with media with or without 200 μM H2O2, intracellular ROS levels of both control and Sirt3 knockdown C2C12 cells were detected with 2.5 μM CM-H2DCFDA by flow cytometry. Using mean fluorescence of cells in either control or Sirt3 KD cells under different conditions, Student's t test was performed for significance (n = 4). (C). Both control and Sirt3 KD cells were incubated in low-glucose (100 mg/dL) DMEM containing 10% FBS with or without 200 μM H2O2 for 2 h following the oxidative challenge protocol that was previously described (26). Quantitative PCR was performed for different stress markers (n = 3). (D) Using cell homogenate, catalase activity assays were performed using catalase assay kit (Calbiochem). SOD activity assays were performed with cell homogenates using a SOD assay kit (n = 4; Cayman Chemical Company). Sirt3 knockdown and control cells were incubated with growth media with 1 mM of H2O2 for 6 h. At the end of the incubation period, all floating and attached cells were collected and resuspended in PBS. Aliquots of 20 μL of resuspended cells were stained with 20 μL 2× trypan blue and were subjected to cell counter analysis for trypan blue staining. The death rates of the cells were calculated on the basis of the percentage of trypan blue positive cells over the total cell number (n = 5).
Fig. 5.
Sirt3 knockdown cells display decreased basal and uncoupled rates OCR. (A) After the Seahorse Bioscience bioenergetic profiling experiment with mitochondrial uncoupler and inhibitors, basal mitochondrial respiration was calculated by subtraction of nonmitochondrial respiration (after rotenone injection) from total basal respiration (before oligomycin injection). (B) Uncoupled respiration stimulated by FCCP was calculated with AUC between the FCCP and rotenone injections. (C) Mitochondria from both WT and Sirt3 KO mice quadriceps muscles were isolated, and lysates were prepared for protein analysis as previously described (41). Western blot using mitochondrial total lysates was performed using anti-AcK antibody and antibodies against complex V subunit α and Sirt3. (D) The same mitochondrial lysates were immunoprecipitated with a polyclonal anti-AcK antibody (Cell Signaling Technology) and then subjected to Western blotting analysis using antibodies against a complex I 39-kDa subunit, a complex III core I subunit, and Hsp60.
Comment in
- SIRT3 weighs heavily in the metabolic balance: a new role for SIRT3 in metabolic syndrome.
Green MF, Hirschey MD. Green MF, et al. J Gerontol A Biol Sci Med Sci. 2013 Feb;68(2):105-7. doi: 10.1093/gerona/gls132. Epub 2012 May 4. J Gerontol A Biol Sci Med Sci. 2013. PMID: 22562958
Similar articles
- SIRT3 weighs heavily in the metabolic balance: a new role for SIRT3 in metabolic syndrome.
Green MF, Hirschey MD. Green MF, et al. J Gerontol A Biol Sci Med Sci. 2013 Feb;68(2):105-7. doi: 10.1093/gerona/gls132. Epub 2012 May 4. J Gerontol A Biol Sci Med Sci. 2013. PMID: 22562958 - Sirt3 regulates metabolic flexibility of skeletal muscle through reversible enzymatic deacetylation.
Jing E, O'Neill BT, Rardin MJ, Kleinridders A, Ilkeyeva OR, Ussar S, Bain JR, Lee KY, Verdin EM, Newgard CB, Gibson BW, Kahn CR. Jing E, et al. Diabetes. 2013 Oct;62(10):3404-17. doi: 10.2337/db12-1650. Epub 2013 Jul 8. Diabetes. 2013. PMID: 23835326 Free PMC article. - Altered Skeletal Muscle Mitochondrial Proteome As the Basis of Disruption of Mitochondrial Function in Diabetic Mice.
Zabielski P, Lanza IR, Gopala S, Heppelmann CJ, Bergen HR 3rd, Dasari S, Nair KS. Zabielski P, et al. Diabetes. 2016 Mar;65(3):561-73. doi: 10.2337/db15-0823. Epub 2015 Dec 30. Diabetes. 2016. PMID: 26718503 Free PMC article. - SIRT3 regulation of mitochondrial oxidative stress.
Bause AS, Haigis MC. Bause AS, et al. Exp Gerontol. 2013 Jul;48(7):634-9. doi: 10.1016/j.exger.2012.08.007. Epub 2012 Aug 31. Exp Gerontol. 2013. PMID: 22964489 Review. - The SirT3 divining rod points to oxidative stress.
Bell EL, Guarente L. Bell EL, et al. Mol Cell. 2011 Jun 10;42(5):561-8. doi: 10.1016/j.molcel.2011.05.008. Mol Cell. 2011. PMID: 21658599 Free PMC article. Review.
Cited by
- Nicotinamide Riboside-Driven Modulation of SIRT3/mtROS/JNK Signaling Pathways Alleviates Myocardial Ischemia-Reperfusion Injury.
Wang L, Chen C, Zhou H, Tao L, Xu E. Wang L, et al. Int J Med Sci. 2024 Aug 12;21(11):2139-2148. doi: 10.7150/ijms.97530. eCollection 2024. Int J Med Sci. 2024. PMID: 39239543 Free PMC article. - Exploring the electrostatic repulsion model in the role of Sirt3 in directing MnSOD acetylation status and enzymatic activity.
Zhu Y, Park SH, Ozden O, Kim HS, Jiang H, Vassilopoulos A, Spitz DR, Gius D. Zhu Y, et al. Free Radic Biol Med. 2012 Aug 15;53(4):828-33. doi: 10.1016/j.freeradbiomed.2012.06.020. Epub 2012 Jun 23. Free Radic Biol Med. 2012. PMID: 22732184 Free PMC article. Review. - The role of AMPK in metabolism and its influence on DNA damage repair.
Szewczuk M, Boguszewska K, Kaźmierczak-Barańska J, Karwowski BT. Szewczuk M, et al. Mol Biol Rep. 2020 Nov;47(11):9075-9086. doi: 10.1007/s11033-020-05900-x. Epub 2020 Oct 18. Mol Biol Rep. 2020. PMID: 33070285 Free PMC article. Review. - Bioenergetic and autophagic control by Sirt3 in response to nutrient deprivation in mouse embryonic fibroblasts.
Liang Q, Benavides GA, Vassilopoulos A, Gius D, Darley-Usmar V, Zhang J. Liang Q, et al. Biochem J. 2013 Sep 1;454(2):249-57. doi: 10.1042/BJ20130414. Biochem J. 2013. PMID: 23767918 Free PMC article. - The sirtuin family's role in aging and age-associated pathologies.
Hall JA, Dominy JE, Lee Y, Puigserver P. Hall JA, et al. J Clin Invest. 2013 Mar;123(3):973-9. doi: 10.1172/JCI64094. Epub 2013 Mar 1. J Clin Invest. 2013. PMID: 23454760 Free PMC article. Review.
References
- Martin BC, et al. Role of glucose and insulin resistance in development of type 2 diabetes mellitus: Results of a 25-year follow-up study. Lancet. 1992;340:925–929. - PubMed
- Brozinick JT, Jr, Roberts BR, Dohm GL. Defective signaling through Akt-2 and -3 but not Akt-1 in insulin-resistant human skeletal muscle: Potential role in insulin resistance. Diabetes. 2003;52:935–941. - PubMed
Publication types
MeSH terms
Substances
Grants and funding
- R01 DK033201/DK/NIDDK NIH HHS/United States
- R24 DK085610/DK/NIDDK NIH HHS/United States
- R01DK33201/DK/NIDDK NIH HHS/United States
- R24DK085610/DK/NIDDK NIH HHS/United States
LinkOut - more resources
Full Text Sources
Other Literature Sources
Molecular Biology Databases
Research Materials


