Biphasic and dosage-dependent regulation of osteoclastogenesis by β-catenin - PubMed (original) (raw)
Biphasic and dosage-dependent regulation of osteoclastogenesis by β-catenin
Wei Wei et al. Mol Cell Biol. 2011 Dec.
Abstract
Wnt/β-catenin signaling is a critical regulator of skeletal physiology. However, previous studies have mainly focused on its roles in osteoblasts, while its specific function in osteoclasts is unknown. This is a clinically important question because neutralizing antibodies against Wnt antagonists are promising new drugs for bone diseases. Here, we show that in osteoclastogenesis, β-catenin is induced during the macrophage colony-stimulating factor (M-CSF)-mediated quiescence-to-proliferation switch but suppressed during the RANKL-mediated proliferation-to-differentiation switch. Genetically, β-catenin deletion blocks osteoclast precursor proliferation, while β-catenin constitutive activation sustains proliferation but prevents osteoclast differentiation, both causing osteopetrosis. In contrast, β-catenin heterozygosity enhances osteoclast differentiation, causing osteoporosis. Biochemically, Wnt activation attenuates whereas Wnt inhibition stimulates osteoclastogenesis. Mechanistically, β-catenin activation increases GATA2/Evi1 expression but abolishes RANKL-induced c-Jun phosphorylation. Therefore, β-catenin exerts a pivotal biphasic and dosage-dependent regulation of osteoclastogenesis. Importantly, these findings suggest that Wnt activation is a more effective treatment for skeletal fragility than previously recognized that confers dual anabolic and anti-catabolic benefits.
Figures
Fig. 1.
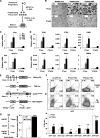
β-Catenin constitutive activation in the osteoclast lineage causes osteopetrosis. (A) Schematic diagram of PPARγ-tTA TRE-cre Catnb+/lox(ex3) (PTbCA) mice. bCA, β-catenin constitutively activated. (B and C) μCT analysis of the tibiae from PTbCA or control (PTctrl) mice (10 months old; male; n = 3). (B) Representative μCT images of the trabecular and cortical bones (scale bars, 10 μm) and the entire proximal tibia (scale bars, 1 mm). (C) Quantification of tibial parameters. The error bars indicate SD. (D) Serum CTX-1 was significantly decreased in PTbCA mice (15 days old; n = 7). (E) Serum osteocalcin was unaltered in PTbCA mice (15 days old; n = 16). (F and G) Static histomorphometric analysis of the femurs showed decreased osteoclast surface (Oc.S/BS) and numbers (Oc.N/B.Ar) (F) but unaltered osteoblast surface (Ob.S/BS) and numbers (Ob.N/B.Ar) (G) in PTbCA mice (15 days old; male; n = 6). B.Ar, bone area. (H) Dynamic histomorphometric analysis with double calcein labeling (2 months old; male; n = 3). (Top) Representative images of the femoral sections illustrating that the distances between the two calcein labels were similar in PTbCA mice and in the controls. Scale bar, 10 μm. (Bottom) Quantification of bone formation rate (BFR/BS) and mineral apposition rate (MAR). (I) Summary of the bone phenotype in the mouse models that harbor β-catenin constitutive activation driven by different cre drivers targeting different stages of osteoclastogenesis. The results are shown as the percent changes in the mutants compared with littermate controls (3 months old; male; n = 4 to 6; P < 0.05). The parameters include tibial trabecular BV/TV ratio, serum CTX-1 and osteocalcin, and osteoclast number (Oc.N) per well in a bone marrow osteoclast differentiation assay. *, _P_ < 0.05; **, _P_ < 0.01; ***, _P_ < 0.005; ****, _P_ < 0.001; ******, _P_ < 0.0001; n.s., nonsignificant (_P_ > 0.05).
Fig. 2.
β-Catenin constitutive activation blocks osteoclast differentiation and sustains osteoclast precursor proliferation. (A) Schematic diagram illustrating the osteoclast differentiation assay. (B) Representative images of TRAP-stained osteoclast differentiation cultures. Bone marrow cells were isolated from PTbCA mutants or littermate controls (15 days old; n = 6). Mature osteoclasts were identified as multinucleated TRAP+ (purple) cells; the osteoclast number/well was determined and is shown as the average ± SD. Scale bar, 25 μm. Veh, vehicle. (C and D) RANKL-induced and BRL-stimulated induction of transcription factors (C) and osteoclast functional genes (D) was impaired in PTbCA cultures (n = 6). R, RANKL; V, vehicle; B, BRL. The error bars indicate SD. (E) Diagram of PPARγ-tTA TRE-Cre Catnb+/lox(ex3) TRE-H2BGFP (PTbCA THG) mice. (F) The osteoclast precursor population was increased in PTbCA THG mice in vivo compared to littermate controls (PTctrl THG). Bone marrow cells were stained with a PE-cKit antibody or a PE-isotype control and analyzed by FACS. (Top) Representative histograms. (Bottom) Percentages of GFP+ and c-Kit+ cells in the bone marrow cell population (n = 6). (G) Bone marrow-derived osteoclast precursors from PTbCA mice showed increased proliferation in response to M-CSF in vitro. (Left) Schematic diagram of the proliferation assay. (Right) Quantification of cell proliferation by BrdU incorporation (n = 6). *, P < 0.05; **, _P_ < 0.01; ****, _P_ < 0.001; n.s., nonsignificant (_P_ > 0.05).
Fig. 3.
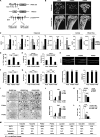
β-Catenin heterozygosity enhances osteoclast differentiation, but β-catenin deletion suppresses osteoclast precursor proliferation. (A) Schematic diagram of the PPARγ-tTA TRE-cre β-cateninfloxed/floxed (PTbKO) mice. (B and C) μCT analysis of the tibiae from PTbHet, PTbKO, or PTctrl mice (6 months old; male; n = 5). (B) Representative images of the trabecular bone of the tibial metaphysis (top; scale bars, 10 μm) and the entire proximal tibia (bottom; scale bars, 1 mm). (C) Quantification of trabecular bone volume and architecture. The asterisks indicate the P value comparing PTctrl and mutant (PTbHet or PTbKO) mice; the pluses indicate the P value comparing PTbKO and PTbHet mice. The error bars indicate SD. (D) Urinary CTX-1 (normalized to creatinine) was increased in PTbHet mice but decreased in PTbKO mice compared with littermate controls (n = 5). (E) Static histomorphometry showed that osteoclast surface and numbers were increased in the PTbHet mice but decreased in the PTbKO mice (n = 5). (F) Serum osteocalcin was unaltered in PTbHet or PTbKO mice (n = 5). (G) Static histomorphometry showed that osteoblast surface and numbers were unaltered (n = 5). (H) Dynamic histomorphometry showed unaltered bone formation rate (BFR) and mineral apposition rate (MAR) (n = 3). (I) In vitro bone marrow osteoclast differentiation was enhanced for PTbHet mice but suppressed for PTbKO mice (n = 3). Mature osteoclasts were identified as multinucleated TRAP+ (purple) cells; the osteoclast number/well was determined and is shown as the average ± SD. Scale bar, 25 m. (J) RANKL-induced and BRL-stimulated induction of transcription factor (c-fos) and osteoclast functional gene (TRAP) (n = 3). R, RANKL; V, vehicle; B, BRL. (K) Bone marrow-derived osteoclast precursors from PTbHet and PTbKO mice showed decreased proliferation in response to M-CSF in vitro (n = 3). (L) Percentage of osteoclast precursors (GFP+) in the bone marrow (BM) was decreased in PTbHet and PTbKO TRE-H2BGFP (THG) reporter mice compared with controls in vivo (n = 3). (M) Summary of the bone phenotype in the mouse models that harbor β-catenin heterozygosity or deletion driven by different cre drivers targeting different stages of osteoclastogenesis. The results are shown as the percent changes in the Het or KO mutants compared with littermate controls (3 months old; male; n = 4 to 6; P < 0.05). Parameters include tibial trabecular BV/TV ratio, serum CTX-1 and osteocalcin, and osteoclast number (Oc.N) per well in a bone marrow osteoclast differentiation assay. *, _P_ < 0.05; ** or ++, _P_ < 0.01; *** or +++, _P_ < 0.005; **** or ++++, _P_ < 0.001; *****, _P_ < 0.0005; ******, _P_ < 0.0001; n.s., nonsignificant (_P_ > 0.05).
Fig. 4.
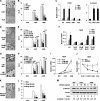
Ectopic β-catenin expression or biochemical Wnt activation attenuates osteoclast differentiation. (A to C) Ectopic overexpression of wild-type β-catenin (bWT) or a constitutively active β-catenin mutant (bCA) attenuated osteoclast differentiation. Bone marrow cells were nontransfected (NT) or transfected with a β-catenin plasmid or a vector (Vec) control before RANKL treatment. (A) Representative images of TRAP-stained osteoclast differentiation cultures. Scale bars, 25 μm. (B) Quantification of the number of multinucleated (>3 nuclei) TRAP+ mature osteoclasts (n = 6). The error bars indicate SD. (C) Expression of a representative osteoclast marker (Ctsk) and β-catenin (n = 3). (D to G) GSK3β inhibition by LiCl attenuated osteoclast differentiation. Bone marrow cells were treated with LiCl or an inactive control, NaCl, at the indicated concentrations. (D) Representative images of TRAP-stained osteoclast differentiation cultures. Scale bars, 25 μm. (E) Quantification of multinucleated (>3 nuclei) TRAP+ mature osteoclasts (n = 6). (F) Expression of a representative osteoclast function gene (TRAP) (n = 3). (G to J) GSK3β inhibition by BIO attenuated osteoclast differentiation. Bone marrow cells were treated with BIO or an inactive control, metBIO, at the indicated concentrations. (G) Representative images of TRAP-stained osteoclast differentiation cultures. Scale bars, 25 μm. (H) Quantification of multinucleated (>3 nuclei) TRAP+ mature osteoclasts (n = 6). (I and J) Expression of a representative osteoclast function gene was suppressed by BIO in a dose-dependent manner (I), but not by the inactive control metBIO (J) (n = 3). (K to M) The Wnt agonist Wnt3A attenuated osteoclast differentiation. Bone marrow cells were treated with Wnt3A or vehicle control at the indicated concentrations. (K) Representative images of TRAP-stained osteoclast differentiation cultures. Scale bars, 25 μm. (L) Quantification of multinucleated (>3 nuclei) TRAP+ mature osteoclasts (n = 6). (M) β-Catenin downregulation by RANKL and BRL was abolished by Wnt3A in a dose-dependent manner. Whole-cell extract was collected after 6 days of differentiation and analyzed by Western blotting. The results were quantified as the β-catenin/β-actin ratio. ^, P < 0.0001; n.s, nonsignificant (_P_ > 0.05).
Fig. 5.
Biochemical Wnt inhibition enhances osteoclast differentiation. (A to C) Bone marrow osteoclast differentiation cultures were treated with the Wnt inhibitor IWRendo or an inactive control, IWRexo, at the indicated concentrations in the presence or absence of RANKL, with or without BRL. Osteoclast formation was analyzed 6 days after differentiation (3 days after RANKL addition). (A) Representative images of TRAP-stained osteoclast differentiation cultures. Scale bars, 25 μm. (B) Quantification of multinucleated (>3 nuclei) TRAP+ mature osteoclasts (n = 6). The error bars indicate SD. (C) Relative mRNA expression of osteoclast marker genes in the differentiation cultures treated with IWRendo, normalized by that treated with the IWRexo inactive control (n = 6). (D) Proliferation of bone marrow-derived osteoclast precursors in response to M-CSF was inhibited by IWRendo, but not by the IWRexo inactive control, in a dose-dependent manner (n = 6). *, P < 0.05; ****, _P_ < 0.001; *****, _P_ < 0.0005; ******, _P_ < 0.0001; n.s., nonsignificant (_P_ > 0.05).
Fig. 6.
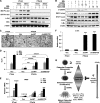
β-Catenin stimulates GATA2 and Evi1 expression. (A to C) Time course expression analyses of in vitro bone marrow osteoclast differentiation (n = 3). β-Catenin and cyclin D1 protein (A), as well as cyclin D1 mRNA (B), were upregulated during M-CSF-mediated precursor proliferation but downregulated during RANKL-mediated osteoclast differentiation and further suppressed by BRL. The error bars indicate SD. d, day. (C) GATA2 mRNA expression was downregulated during osteoclastogenesis and suppressed by BRL. The arrows in panels B and C indicate that M-CSF was added on day 0 and that RANKL and M-CSF were added on day 3. (D) The β-catenin protein level was downregulated by RANKL and further reduced by BRL in control osteoclast differentiation cultures but remained constitutively high in PTbCA cultures. Whole-cell extract was collected on day 6 and analyzed by Western blotting. (E to G) Gene expression in PTbCA and control cultures on day 6 of differentiation from bone marrow (BM) or splenocytes (SP) (n = 3). GATA2 (E) and Evi1 (F) mRNA expression was increased in PTbCA cultures. (G) PU.1 mRNA expression was unaltered in PTbCA cultures. (H) The GSK3β inhibitor LiCl (3 mM), but not the inactive control NaCl (3 mM), increased GATA2 and Evi2 mRNA expression after 6 days of differentiation (n = 3). The P values compare treatment with the control. (I) GATA2 or Evi1 knockdown partially rescued the osteoclast differentiation blockade in PTbCA cultures. Bone marrow cells were transfected with GATA2 siRNA, Evi1 siRNA, or a control siRNA for 3 days before RANKL stimulation. Representative osteoclast marker genes were measured by RT-QPCR (n = 3). The P values compare RANKL with Veh. *, P < 0.05; **, _P_ < 0.01; ***, _P_ < 0.005; ****, _P_ < 0.001; *****, _P_ < 0.0005; ******, _P_ < 0.0001; n.s., nonsignificant (_P_ > 0.05).
Fig. 7.
β-Catenin blocks c-Jun activation. (A) RANKL-induced and BRL-stimulated c-Jun phosphorylation, but not IκBα degradation, were abolished in PTbCA cultures. Bone marrow cells from PTbCA or PTctrl mice were treated with M-CSF for 3 days in the presence or absence of BRL and then stimulated with RANKL for 15 or 30 min. Whole-cell extract was analyzed by Western blotting. (B) RANKL-induced and BRL-stimulated β-catenin downregulation and c-Jun phosphorylation, but not IκBα degradation, were abolished by the GSK3β inhibitor LiCl, but not by the inactive control, NaCl. Whole-cell extract was collected on day 6 and analyzed by Western blotting. (C to F) Ectopic overexpression of either a wild-type c-Jun (JunWT) or a constitutively active c-Jun mutant (JunS63/73D) rescued the osteoclast differentiation blockade in PTbCA cultures. Bone marrow cells were transfected with a c-Jun plasmid or a vector control (Vec) and differentiated with RANKL and M-CSF, with or without BRL. (C) Representative images of TRAP-stained osteoclast differentiation cultures. Scale bars, 25 μm. (D) Quantification of multinucleated (>3 nuclei) TRAP+ mature osteoclasts (n = 6). The error bars indicate SD. (E) Quantification of the mRNA expression of a representative osteoclast functional gene (n = 3). (F) Quantification of the mRNA expression of c-Jun (n = 3). (G) Simplified model illustrating the biphasic and dosage-dependent regulation of osteoclastogenesis by β-catenin. β-Catenin and its cyclin D1 target gene are induced by M-CSF to promote the quiescence-to-proliferation switch but are downregulated by RANKL to permit the proliferation-to-differentiation switch. β-Catenin dosage reduction, for example, by the PPARγ agonist BRL, accelerates osteoclastogenesis. *, P < 0.05; **, _P_ < 0.01; ***, _P_ < 0.005; ****, _P_ < 0.001; *****, _P_ < 0.0005; ******, _P_ < 0.0001; n.s., nonsignificant (_P_ > 0.05).
Similar articles
- Psoralen and Bakuchiol Ameliorate M-CSF Plus RANKL-Induced Osteoclast Differentiation and Bone Resorption Via Inhibition of AKT and AP-1 Pathways in Vitro.
Chai L, Zhou K, Wang S, Zhang H, Fan N, Li J, Tan X, Hu L, Fan X. Chai L, et al. Cell Physiol Biochem. 2018;48(5):2123-2133. doi: 10.1159/000492554. Epub 2018 Aug 15. Cell Physiol Biochem. 2018. PMID: 30110702 - Osteoclast progenitors reside in the peroxisome proliferator-activated receptor γ-expressing bone marrow cell population.
Wei W, Zeve D, Wang X, Du Y, Tang W, Dechow PC, Graff JM, Wan Y. Wei W, et al. Mol Cell Biol. 2011 Dec;31(23):4692-705. doi: 10.1128/MCB.05979-11. Epub 2011 Sep 26. Mol Cell Biol. 2011. PMID: 21947280 Free PMC article. - The Blimp1-Bcl6 axis is critical to regulate osteoclast differentiation and bone homeostasis.
Miyauchi Y, Ninomiya K, Miyamoto H, Sakamoto A, Iwasaki R, Hoshi H, Miyamoto K, Hao W, Yoshida S, Morioka H, Chiba K, Kato S, Tokuhisa T, Saitou M, Toyama Y, Suda T, Miyamoto T. Miyauchi Y, et al. J Exp Med. 2010 Apr 12;207(4):751-62. doi: 10.1084/jem.20091957. Epub 2010 Apr 5. J Exp Med. 2010. PMID: 20368579 Free PMC article. - TRAF2 is essential for TNF-alpha-induced osteoclastogenesis.
Kanazawa K, Kudo A. Kanazawa K, et al. J Bone Miner Res. 2005 May;20(5):840-7. doi: 10.1359/JBMR.041225. Epub 2004 Dec 20. J Bone Miner Res. 2005. PMID: 15824857 - [RANKL signaling and bone diseases. Quiescent osteoclast precursors and RANKL signaling].
Mizoguchi T. Mizoguchi T. Clin Calcium. 2011 Aug;21(8):1187-92. Clin Calcium. 2011. PMID: 21814024 Review. Japanese.
Cited by
- Canonical Wnt signaling inhibits osteoclastogenesis independent of osteoprotegerin.
Albers J, Keller J, Baranowsky A, Beil FT, Catala-Lehnen P, Schulze J, Amling M, Schinke T. Albers J, et al. J Cell Biol. 2013 Feb 18;200(4):537-49. doi: 10.1083/jcb.201207142. Epub 2013 Feb 11. J Cell Biol. 2013. PMID: 23401003 Free PMC article. - Zebrafish mutants reveal unexpected role of Lrp5 in osteoclast regulation.
Khrystoforova I, Shochat-Carvalho C, Harari R, Henke K, Woronowicz K, Harris MP, Karasik D. Khrystoforova I, et al. Front Endocrinol (Lausanne). 2022 Sep 2;13:985304. doi: 10.3389/fendo.2022.985304. eCollection 2022. Front Endocrinol (Lausanne). 2022. PMID: 36120446 Free PMC article. - Abnormal dental follicle cells: A crucial determinant in tooth eruption disorders (Review).
Chen J, Ying Y, Li H, Sha Z, Lin J, Wu Y, Wu Y, Zhang Y, Chen X, Zhang W. Chen J, et al. Mol Med Rep. 2024 Sep;30(3):168. doi: 10.3892/mmr.2024.13292. Epub 2024 Jul 19. Mol Med Rep. 2024. PMID: 39027997 Free PMC article. Review. - Network and pathway-based analyses of genes associated with osteoporosis.
Gu H, Huang Z, Chen G, Zhou K, Zhang Y, Chen J, Xu J, Yin X. Gu H, et al. Medicine (Baltimore). 2020 Feb;99(8):e19120. doi: 10.1097/MD.0000000000019120. Medicine (Baltimore). 2020. PMID: 32080087 Free PMC article. - Effects of estrogen on bone mRNA levels of sclerostin and other genes relevant to bone metabolism in postmenopausal women.
Fujita K, Roforth MM, Demaray S, McGregor U, Kirmani S, McCready LK, Peterson JM, Drake MT, Monroe DG, Khosla S. Fujita K, et al. J Clin Endocrinol Metab. 2014 Jan;99(1):E81-8. doi: 10.1210/jc.2013-3249. Epub 2013 Dec 20. J Clin Endocrinol Metab. 2014. PMID: 24170101 Free PMC article. Clinical Trial.
References
- Ash P., Loutit J. F., Townsend K. M. 1980. Osteoclasts derived from haematopoietic stem cells. Nature 283:669–670 - PubMed
- Bai S., et al. 2008. NOTCH1 regulates osteoclastogenesis directly in osteoclast precursors and indirectly via osteoblast lineage cells. J. Biol. Chem. 283:6509–6518 - PubMed
- Bohmann D., Tjian R. 1989. Biochemical analysis of transcriptional activation by Jun: differential activity of c- and v-Jun. Cell 59:709–717 - PubMed
- Brault V., et al. 2001. Inactivation of the beta-catenin gene by Wnt1-Cre-mediated deletion results in dramatic brain malformation and failure of craniofacial development. Development 128:1253–1264 - PubMed
Publication types
MeSH terms
Substances
Grants and funding
- R01 DK064261/DK/NIDDK NIH HHS/United States
- R01 DK066556/DK/NIDDK NIH HHS/United States
- R01 DK088220/DK/NIDDK NIH HHS/United States
- R01 DK089113/DK/NIDDK NIH HHS/United States
LinkOut - more resources
Full Text Sources
Molecular Biology Databases
Research Materials
Miscellaneous


