The interferon-inducible gene viperin restricts West Nile virus pathogenesis - PubMed (original) (raw)
The interferon-inducible gene viperin restricts West Nile virus pathogenesis
Kristy J Szretter et al. J Virol. 2011 Nov.
Abstract
Type I interferon (IFN) signaling coordinates an early antiviral program in infected and uninfected cells by inducing IFN-stimulated genes (ISGs) that modulate viral entry, replication, and assembly. However, the specific antiviral functions in vivo of most ISGs remain unknown. Here, we examined the contribution of the ISG viperin to the control of West Nile virus (WNV) in genetically deficient cells and mice. While modest increases in levels of WNV replication were observed for primary viperin(-/-) macrophages and dendritic cells, no appreciable differences were detected in deficient embryonic cortical neurons or fibroblasts. In comparison, viperin(-/-) adult mice infected with WNV via the subcutaneous or intracranial route showed increased lethality and/or enhanced viral replication in central nervous system (CNS) tissues. In the CNS, viperin expression was induced in both WNV-infected and adjacent uninfected cells, including activated leukocytes at the site of infection. Our experiments suggest that viperin restricts the infection of WNV in a tissue- and cell-type-specific manner and may be an important ISG for controlling viral infections that cause CNS disease.
Figures
Fig. 1.
Survival and viral burden analysis of wild-type and viperin_−/−_ C57BL/6 mice. (A) Nine-week-old age-matched wild-type (n = 8) and viperin_−/−_ (n = 11) mice were inoculated subcutaneously with 102 PFU of WNV, and mice were monitored for 21 days for mortality. Survival differences were statistically significant (P = 0.03). (B to G) WNV tissue burden and spread in mice after subcutaneous infection. Viperin_−/−_ and wild-type mice were infected with 102 PFU of WNV via subcutaneous injection into the footpad. At the indicated times postinfection, tissues were harvested and analyzed for viral burden by qRT-PCR (B and C) or plaque assay (D to G). Data are shown as WNV genome equivalents per microgram of 18S rRNA (r18S) or PFU per gram of tissue for 8 to 16 mice per time point. Solid lines represent the median viral titer, and dotted lines indicate the limit of detection of the respective assays. Asterisks indicate values that are statistically significant (*, P < 0.05).
Fig. 2.
Effect of viperin on the peripheral type I IFN response after WNV infection. Viperin_−/−_ and wild-type mice were inoculated with 102 PFU of WNV by subcutaneous injection into the footpad. At the indicated times postinfection, serum was collected, and type I IFN activity was determined by an encephalomyocarditis virus cytopathic effect bioassay with L929 cells. The dotted line indicates the limit of detection of the assay, and data representing 5 to 15 mice at each time point are expressed as the average values on a log10 scale. Asterisks indicate differences that are statistically significant by the Mann-Whitney test (*, P < 0.05), which was performed on linear IFN levels.
Fig. 3.
Viperin restricts WNV infection in primary myeloid cells. (A to D) Fibroblasts (A) and cortical neurons (B) were generated from embryos of wild-type and viperin_−/−_ mice, and bone marrow-derived dendritic cells (C) and macrophages (D) were isolated from adult wild-type and viperin_−/−_ mice. Primary cells were infected at an MOI of 0.01, and the virus yield was titrated at the indicated times by plaque assay on BHK21-15 or Vero cells. Values are averages of values from triplicate samples generated from at least three independent experiments. The dotted line represents the limit of detection for the assay. (E and F) WNV-infected macrophages were harvested 72 h after infection, stained with WNV-specific monoclonal antibody E16, and analyzed by flow cytometry. Asterisks indicate values that are statistically different (*, P < 0.05; **, P < 0.005).
Fig. 4.
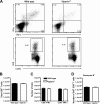
Peripheral T cell responses after WNV infection in viperin_−/−_ mice. Wild-type and viperin_−/−_ mice were inoculated with 102 PFU of WNV by footpad injection, and spleens were harvested on day 8. (A, top) Flow cytometry dot plots showing intracellular IFN-γ and TNF-α cells after gating on CD8α+ T cells. Cells were restimulated ex vivo with a Db-restricted NS4b peptide. (Bottom) Intracellular expression of granzyme B (GrB) in CD8+ T cells from WNV-infected mice. (B) Bulk numbers of splenic CD8+ T cells at day 8 after infection in wild-type and viperin_−/−_ mice. (C and D) Leukocytes were stained for granzyme B expression or stimulated with the NS4b peptide, incubated with antibodies for CD3 and CD8 and IFN-γ or TNF-α, and analyzed by flow cytometry. Data are shown as the total numbers of CD3+ CD8+ T cells that expressed intracellular granzyme B, IFN-γ, or TNF-α after peptide restimulation. The differences were not statistically significant, and the data were pooled from three independent experiments with a total of 7 to 8 mice.
Fig. 5.
Leukocyte accumulation in the CNS of viperin_−/−_ mice after WNV infection. Wild-type and viperin_−/−_ mice were inoculated with 102 PFU of WNV by subcutaneous injection into the footpad. Brains (A to D) and spinal cords (E to H) were harvested on days 9 and 10, respectively, and leukocytes were isolated by Percoll gradient centrifugation. (A and E) The total number of CD3+ CD4+ or CD3+ CD8+ T cells was determined by multiplying the percentage of CD3+ CD8+ cells by the total cell count. (B and C) Brain leukocytes were stimulated ex vivo with a Db-restricted NS4b WNV peptide; stained for CD3 and CD8 and intracellular granzyme B, IFN-γ, or TNF-α; and analyzed by flow cytometry. (F and G) Spinal cord leukocytes were stained directly with Db-NS4b tetramers and antibodies to CD8 and granzyme B. (D and H) The numbers of macrophages (CD11bhigh/CD45high) and microglia (CD11bhigh/CD45low) were also measured. Differences were not statistically significant, and data represent the averages of data from 3 to 4 independent experiments with 3 to 5 mice per experiment (n = 11 to 19).
Fig. 6.
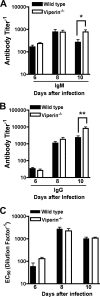
WNV-specific antibody responses in viperin_−/−_ mice. Wild-type and viperin_−/−_ mice were infected with 102 PFU of WNV by subcutaneous injection into the footpad. At the indicated times postinfection, serum was collected and assayed by ELISA for WNV E-specific IgM (A) and IgG (B) antibody titers. Data represent the reciprocal endpoint titers. (C) Sera from the indicated times postinfection were tested for neutralization activity using a focus reduction assay. Data represent the effective concentration that produced 50% neutralization of WNV infection (EC50). Asterisks indicate values that are statistically significant (*, P < 0.05; **, P < 0.005).
Fig. 7.
WNV replication in regions of the CNS of viperin−/− mice after intracranial infection. Viperin_−/−_ and wild-type mice were infected with 101 PFU WNV via intracranial injection. At the indicated times postinfection, cerebral cortex (gray matter) (A), white matter (B), brain stem (C), cerebellum (D), and spinal cord (E) were harvested and analyzed for viral burden by plaque assay on BHK21-15 cells. Data are shown as PFU per gram of tissue for 7 to 17 mice per time point. Solid lines represent the median viral titers, and dotted lines indicate the limit of detection of the respective assays. Asterisks indicate values that are statistically significant (*, P < 0.05; **, P < 0.005).
Fig. 8.
Viperin protein expression in the CNS after WNV infection. Wild-type mice were infected with 101 PFU WNV via intracranial injection. At day 6, tissues were harvested and processed as described in Materials and Methods. (A to G) Fixed, frozen sections from the cerebral cortex (A); hippocampus (B); cerebellum (C); brain stem (D); and cervical (E), thoracic (F), and lumbar (G) spinal cord were costained for WNV antigen (red), viperin (green), and the nuclear stain ToPro-3 (blue). Images are representative of 4 to 6 wild-type mice. Arrows define cells that were WNV infected and stained positive for viperin, whereas arrowheads denote cells that stained positive for viperin but were not appreciably infected. (H to J) Representative images from WNV-infected viperin_−/−_ cerebral cortex (H) and thoracic spinal cord (I) and mock-infected wild-type cerebellum (J) were also included as staining controls. Bars indicate a 20-μm scale.
Similar articles
- The Interferon-Stimulated Gene Ifi27l2a Restricts West Nile Virus Infection and Pathogenesis in a Cell-Type- and Region-Specific Manner.
Lucas TM, Richner JM, Diamond MS. Lucas TM, et al. J Virol. 2015 Dec 23;90(5):2600-15. doi: 10.1128/JVI.02463-15. J Virol. 2015. PMID: 26699642 Free PMC article. - Cell-type- and region-specific restriction of neurotropic flavivirus infection by viperin.
Lindqvist R, Kurhade C, Gilthorpe JD, Överby AK. Lindqvist R, et al. J Neuroinflammation. 2018 Mar 15;15(1):80. doi: 10.1186/s12974-018-1119-3. J Neuroinflammation. 2018. PMID: 29544502 Free PMC article. - Toll-like receptor 3 has a protective role against West Nile virus infection.
Daffis S, Samuel MA, Suthar MS, Gale M Jr, Diamond MS. Daffis S, et al. J Virol. 2008 Nov;82(21):10349-58. doi: 10.1128/JVI.00935-08. Epub 2008 Aug 20. J Virol. 2008. PMID: 18715906 Free PMC article. - Immune responses to West Nile virus infection in the central nervous system.
Cho H, Diamond MS. Cho H, et al. Viruses. 2012 Dec 17;4(12):3812-30. doi: 10.3390/v4123812. Viruses. 2012. PMID: 23247502 Free PMC article. Review. - Innate immune evasion by hepatitis C virus and West Nile virus.
Keller BC, Johnson CL, Erickson AK, Gale M Jr. Keller BC, et al. Cytokine Growth Factor Rev. 2007 Oct-Dec;18(5-6):535-44. doi: 10.1016/j.cytogfr.2007.06.006. Epub 2007 Aug 16. Cytokine Growth Factor Rev. 2007. PMID: 17702639 Free PMC article. Review.
Cited by
- HIV-induced RSAD2/Viperin supports sustained infection of monocyte-derived macrophages.
Zankharia U, Yi Y, Lu F, Vladimirova O, Karisetty BC, Wikramasinghe J, Kossenkov A, Collman RG, Lieberman PM. Zankharia U, et al. J Virol. 2024 Oct 22;98(10):e0086324. doi: 10.1128/jvi.00863-24. Epub 2024 Sep 11. J Virol. 2024. PMID: 39258908 - Pathogenicity and virulence of O'nyong-nyong virus: A less studied Togaviridae with pandemic potential.
Tong Jia Ming S, Tan Yi Jun K, Carissimo G. Tong Jia Ming S, et al. Virulence. 2024 Dec;15(1):2355201. doi: 10.1080/21505594.2024.2355201. Epub 2024 May 26. Virulence. 2024. PMID: 38797948 Free PMC article. Review. - CRISPR activation as a platform to identify interferon stimulated genes with anti-viral function.
Kirby EN, Montin XB, Allen TP, Densumite J, Trowbridge BN, Beard MR. Kirby EN, et al. Innate Immun. 2024 Feb;30(2-4):40-54. doi: 10.1177/17534259231225611. Epub 2024 Jan 23. Innate Immun. 2024. PMID: 38258394 Free PMC article. - ATG14 targets lipid droplets and acts as an autophagic receptor for syntaxin18-regulated lipid droplet turnover.
Yuan Z, Cai K, Li J, Chen R, Zhang F, Tan X, Jiu Y, Chang H, Hu B, Zhang W, Ding B. Yuan Z, et al. Nat Commun. 2024 Jan 20;15(1):631. doi: 10.1038/s41467-024-44978-w. Nat Commun. 2024. PMID: 38245527 Free PMC article. - Antiviral Effect of hBD-3 and LL-37 during Human Primary Keratinocyte Infection with West Nile Virus.
Chessa C, Bodet C, Jousselin C, Larivière A, Damour A, Garnier J, Lévêque N, Garcia M. Chessa C, et al. Viruses. 2022 Jul 15;14(7):1552. doi: 10.3390/v14071552. Viruses. 2022. PMID: 35891533 Free PMC article.
References
- Austin B. A., James C., Silverman R. H., Carr D. J. 2005. Critical role for the oligoadenylate synthetase/RNase L pathway in response to IFN-beta during acute ocular herpes simplex virus type 1 infection. J. Immunol. 175: 1100–1106 - PubMed
- Boulant S., Targett-Adams P., McLauchlan J. 2007. Disrupting the association of hepatitis C virus core protein with lipid droplets correlates with a loss in production of infectious virus. J. Gen. Virol. 88: 2204–2213 - PubMed
- Brien J. D., Uhrlaub J. L., Nikolich-Zugich J. 2007. Protective capacity and epitope specificity of CD8(+) T cells responding to lethal West Nile virus infection. Eur. J. Immunol. 37: 1855–1863 - PubMed
Publication types
MeSH terms
Substances
Grants and funding
- U54 AI081680/AI/NIAID NIH HHS/United States
- U19 AI083019/AI/NIAID NIH HHS/United States
- R01 AI054483/AI/NIAID NIH HHS/United States
- T32 AI007172/AI/NIAID NIH HHS/United States
- U54 AI057160/AI/NIAID NIH HHS/United States
- T32-AI007172/AI/NIAID NIH HHS/United States
LinkOut - more resources
Full Text Sources
Molecular Biology Databases


