Temporally controlled modulation of FGF/ERK signaling directs midbrain dopaminergic neural progenitor fate in mouse and human pluripotent stem cells - PubMed (original) (raw)
. 2011 Oct;138(20):4363-74.
doi: 10.1242/dev.066746. Epub 2011 Aug 31.
Affiliations
- PMID: 21880784
- PMCID: PMC3177308
- DOI: 10.1242/dev.066746
Temporally controlled modulation of FGF/ERK signaling directs midbrain dopaminergic neural progenitor fate in mouse and human pluripotent stem cells
Ines Jaeger et al. Development. 2011 Oct.
Abstract
Effective induction of midbrain-specific dopamine (mDA) neurons from stem cells is fundamental for realizing their potential in biomedical applications relevant to Parkinson's disease. During early development, the Otx2-positive neural tissues are patterned anterior-posteriorly to form the forebrain and midbrain under the influence of extracellular signaling such as FGF and Wnt. In the mesencephalon, sonic hedgehog (Shh) specifies a ventral progenitor fate in the floor plate region that later gives rise to mDA neurons. In this study, we systematically investigated the temporal actions of FGF signaling in mDA neuron fate specification of mouse and human pluripotent stem cells and mouse induced pluripotent stem cells. We show that a brief blockade of FGF signaling on exit of the lineage-primed epiblast pluripotent state initiates an early induction of Lmx1a and Foxa2 in nascent neural progenitors. In addition to inducing ventral midbrain characteristics, the FGF signaling blockade during neural induction also directs a midbrain fate in the anterior-posterior axis by suppressing caudalization as well as forebrain induction, leading to the maintenance of midbrain Otx2. Following a period of endogenous FGF signaling, subsequent enhancement of FGF signaling by Fgf8, in combination with Shh, promotes mDA neurogenesis and restricts alternative fates. Thus, a stepwise control of FGF signaling during distinct stages of stem cell neural fate conversion is crucial for reliable and highly efficient production of functional, authentic midbrain-specific dopaminergic neurons. Importantly, we provide evidence that this novel, small-molecule-based strategy applies to both mouse and human pluripotent stem cells.
Figures
Fig. 1.
EpiSCs enter the neuroectoderm lineage faster than ESCs. (A) Mouse ESC and EpiSC MD cultures immunostained for Oct4 and Sox2 at day 4 (top) and nestin at day 6 (bottom). DAPI labeling is in blue. (B) qPCR analysis for the expression of pluripotency and neural lineage genes over 12-day MD cultures of ESCs and EpiSCs. Data represent mean±s.e.m. from triplicate cultures of a single experiment.
Fig. 2.
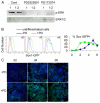
FGF/ERK inhibition accelerates neural fate conversion of EpiSCs. (A) Western blot analysis for phospho-ERK in day-2 mouse EpiSC differentiation cultures treated with PD0325901 (PD) or PD173074. Samples were loaded undiluted (1) or diluted 1:2 in loading buffer. (B) MD cultures of Sox1-GFP EpiSCs in the presence or absence of PD. Sox1-GFP reporter expression was analyzed by flow cytometry and the percentage of Sox1-GFP+ cells was determined from three independent cultures. Error bars indicate s.e.m. (C) Antibody staining for a neural rosette marker PLZF (green) in d2, d4 and d6 MD cultures with or without PD. DAPI labeling is in blue. Scale bars: 100 μm.
Fig. 3.
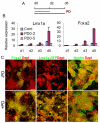
FGF/ERK blockade at the onset of neural fate conversion induces mDA regulatory genes. (A) Experimental schemes. E14tg2a mouse EpiSC monolayer cultures were exposed to PD0325901 (PD) from d0 MD for either 2 days (PD0-2) or 5 days (PD0-5). Cultures were harvested at d1, d2, d3 and d5 MD. (B) qPCR analysis of Lmx1a and Foxa2. The value of the d1 MD control (Cont) was set as 1. Error bars indicate mean±s.e.m. of two sets of experiments performed in duplicate. (C) d5 MD of Lmx1a-GFP EpiSCs exposed to PD from d0 MD for 2 days were immunostained for Foxa2 and GFP (both green) and counterstained with DAPI (red). Scale bar: 100 μm.
Fig. 4.
Stepwise inactivation and activation of FGF/ERK signaling leads to the highly efficient production of dopamine neurons exhibiting mDA components. (A) Outline of the experiment using the Pitx3-GFP EpiSCs. (B) Immunostaining of mouse d14 MD cultures for (a-d) Th (red) and Tuj1 (blue) as well as (e-h) Th (red) and Pitx3-GFP (green). (C) Quantification of the immunostaining in B, illustrating the percentage of Th+ neurons and Th+ neurons co-expressing Pitx3. Mean±s.e.m. *, P<0.01 relative to no-PD control (Student's _t_-test). (D) Immunostaining of d14 MD cultures for various midbrain and pan-DA markers. Scale bars: 200 μm for Ba,b,e,f; 50 μm for Bc,d,g,h,D.
Fig. 5.
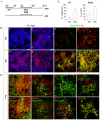
FGF inhibition directs a midbrain neural progenitor fate. (A) Mouse E14tg2a EpiSC monolayer cultures were exposed to PD0325901 (PD) from d0 MD for 2 (PD0-2) or 5 (PD0-5) days. Cultures were harvested at day 1, 2, 3 or 5 for qPCR analysis of Shh and Wnt1. (B) E14tg2a EpiSC MD cultures were treated with PD or cyclopamine (Cycl) or a combination of the two as indicated. Cultures were harvested at day 1, 2, 3 or 5 for qPCR analysis of Lmx1a and Foxa2. (C) EpiSCs were differentiated in the presence of PD or Shh for 2 days from d0 MD, as in B, and analyzed for Gbx2, En1 and En2 by qPCR at d1-3 and d5 MD. (D) Experimental schemes for E-G. (E) Immunostaining of d5 and d9 MD E14tg2a (top two rows) and Lmx1a-GFP (bottom two rows) EpiSCs. Antibodies against Otx2 (red) and nestin (green), or Otx2 alone (red), were used in E14tg2a EpiSCs. Foxa2 (green), nestin (red) and GFP (green) were used in the Lmx1a-GFP panels. Scale bar: 100 μm. (F) Quantification of immunostaining in E illustrating the percentage of cells expressing Otx2. Mean±s.e.m. of ten fields from two independent experiments. *, P<0.01 relative to no-PD control (Student's _t_-test). (G) qPCR analysis of the telencephalic markers Six3 and Foxg1 in d2-4 MD cultures with or without PD. Data in A-C,G are mean±s.e.m. of three replicate cultures.
Fig. 6.
Shh and FGF8 act on distinct aspects of mDA neuron differentiation. (A) Experimental scheme for data in B and C. (B) qPCR analysis of mouse d6 MD cultures for the ventral mesencephalic regulator genes Lmx1a, Foxa2, Msx1 and Shh and the isthmus-expressed midbrain patterning genes Wnt1, En1 and En2. (C) qPCR analysis at d9 MD for Wnt1, En1 and En2. PD0325901 (PD) was added for 2 days from d0-2, whereas Shh and/or FGF8 were added from d5. (D) qPCR analysis of Helt, Gata2 and Gad1 in d5 and d9 MD cultures. Expression levels were examined in control MD cultures with no added factors, control cultures treated with Shh between d5 and d9 alone, as well as in cultures treated with PD at d0-2 followed by Shh between d5 and d9 MD. Data in B and C are mean±s.e.m. of two experiments performed in duplicate, whereas data in D are mean± s.e.m. of triplicate cultures from one representative experiment.
Fig. 7.
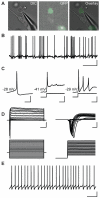
Pitx3-GFP+ cells exhibit functional neuron-like electrophysiological properties. (A) DIC and GFP image showing a recording pipette patched onto a mouse Pitx3-GFP+ cell. (B) Spontaneous action potentials fired by a day-14 neuron. Vertical scale bar, 20 mV; horizontal scale bar, 5 mseconds. (C) A single spontaneous action potential (left). A single action potential fired in response to a 50 pA depolarizing current pulse (middle). Multiple action potentials fired in response to a 50 pA depolarizing current pulse (right). Vertical bars, 20 mV; horizontal bars, 50, 100 and 100 mseconds, respectively. (D) Outward current evoked by a serious of voltage steps (left). Fast inward current evoked by a series of voltage steps (right). Vertical bars, 1 nA; horizontal bars, 50 mseconds. (E) Pacemaker-like spontaneous firing a day-41 neuron. Vertical bar, 20 mV; horizontal bar, 1 second.
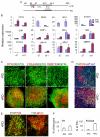
Fig. 8.
Generation of mDA neurons from human ESCs. (A) Experimental schemes. (B) qPCR analysis of regional markers in d7 and d11 H7 MD cultures with or without PD0325901 (PD). Data are mean±s.e.m. of three replicate cultures. (C) Double immunostaining of d13 H1 MD cultures for nestin (green) plus OTX2, FOXA2 or DMRT5 (all in red). (D) Triple antibody staining of d35 H7 cultures for FOXA2 (red), TH (green) and β3-tubulin (TUJ1, blue). (E) Immunostaining of PD-treated d32 H7 MD cultures for PITX3 (red) and TH (green), and for LMX1Aa (red) and TH (green). (F) Quantification of the immunostaining in E, illustrating the percentage of TH+ neurons and TH+ neurons co-expressing FOXA2. Error bars indicate s.e.m. Scale bars: 75 μm.
Similar articles
- BMP/SMAD Pathway Promotes Neurogenesis of Midbrain Dopaminergic Neurons In Vivo and in Human Induced Pluripotent and Neural Stem Cells.
Jovanovic VM, Salti A, Tilleman H, Zega K, Jukic MM, Zou H, Friedel RH, Prakash N, Blaess S, Edenhofer F, Brodski C. Jovanovic VM, et al. J Neurosci. 2018 Feb 14;38(7):1662-1676. doi: 10.1523/JNEUROSCI.1540-17.2018. Epub 2018 Jan 10. J Neurosci. 2018. PMID: 29321139 Free PMC article. - Excessive Wnt/beta-catenin signaling promotes midbrain floor plate neurogenesis, but results in vacillating dopamine progenitors.
Nouri N, Patel MJ, Joksimovic M, Poulin JF, Anderegg A, Taketo MM, Ma YC, Awatramani R. Nouri N, et al. Mol Cell Neurosci. 2015 Sep;68:131-42. doi: 10.1016/j.mcn.2015.07.002. Epub 2015 Jul 9. Mol Cell Neurosci. 2015. PMID: 26164566 Free PMC article. - Differentiation of human ES and Parkinson's disease iPS cells into ventral midbrain dopaminergic neurons requires a high activity form of SHH, FGF8a and specific regionalization by retinoic acid.
Cooper O, Hargus G, Deleidi M, Blak A, Osborn T, Marlow E, Lee K, Levy A, Perez-Torres E, Yow A, Isacson O. Cooper O, et al. Mol Cell Neurosci. 2010 Nov;45(3):258-66. doi: 10.1016/j.mcn.2010.06.017. Epub 2010 Jul 24. Mol Cell Neurosci. 2010. PMID: 20603216 Free PMC article. - Midbrain dopaminergic neuron fate specification: Of mice and embryonic stem cells.
Gale E, Li M. Gale E, et al. Mol Brain. 2008 Sep 30;1:8. doi: 10.1186/1756-6606-1-8. Mol Brain. 2008. PMID: 18826576 Free PMC article. Review. - Induction and specification of midbrain dopaminergic cells: focus on SHH, FGF8, and TGF-beta.
Roussa E, Krieglstein K. Roussa E, et al. Cell Tissue Res. 2004 Oct;318(1):23-33. doi: 10.1007/s00441-004-0916-4. Epub 2004 Aug 19. Cell Tissue Res. 2004. PMID: 15322912 Review.
Cited by
- Specification of midbrain dopamine neurons from primate pluripotent stem cells.
Xi J, Liu Y, Liu H, Chen H, Emborg ME, Zhang SC. Xi J, et al. Stem Cells. 2012 Aug;30(8):1655-63. doi: 10.1002/stem.1152. Stem Cells. 2012. PMID: 22696177 Free PMC article. - Crosstalk of Intercellular Signaling Pathways in the Generation of Midbrain Dopaminergic Neurons In Vivo and from Stem Cells.
Brodski C, Blaess S, Partanen J, Prakash N. Brodski C, et al. J Dev Biol. 2019 Jan 15;7(1):3. doi: 10.3390/jdb7010003. J Dev Biol. 2019. PMID: 30650592 Free PMC article. Review. - Stem cells and regenerative therapies for Parkinson's disease.
Farrell K, Barker RA. Farrell K, et al. Degener Neurol Neuromuscul Dis. 2012 Jul 15;2:79-92. doi: 10.2147/DNND.S16087. eCollection 2012. Degener Neurol Neuromuscul Dis. 2012. PMID: 30890881 Free PMC article. Review. - Gorlin syndrome-induced pluripotent stem cells form medulloblastoma with loss of heterozygosity in PTCH1.
Ikemoto Y, Miyashita T, Nasu M, Hatsuse H, Kajiwara K, Fujii K, Motojima T, Kokido I, Toyoda M, Umezawa A. Ikemoto Y, et al. Aging (Albany NY). 2020 May 21;12(10):9935-9947. doi: 10.18632/aging.103258. Epub 2020 May 21. Aging (Albany NY). 2020. PMID: 32436863 Free PMC article.
References
- Alberi L., Sgado P., Simon H. H. (2004). Engrailed genes are cell-autonomously required to prevent apoptosis in mesencephalic dopaminergic neurons. Development 131, 3229-3236 - PubMed
- Andersson E., Tryggvason U., Deng Q., Friling S., Alekseenko Z., Robert B., Perlmann T., Ericson J. (2006). Identification of intrinsic determinants of midbrain dopamine neurons. Cell 124, 393-405 - PubMed
- Barberi T., Klivenyi P., Calingasan N. Y., Lee H., Kawamata H., Loonam K., Perrier A. L., Bruses J., Rubio M. E., Topf N., et al. (2003). Neural subtype specification of fertilization and nuclear transfer embryonic stem cells and application in parkinsonian mice. Nat. Biotechnol. 21, 1200-1207 - PubMed
- Bouhon I. A., Kato H., Chandran S., Allen N. D. (2005). Neural differentiation of mouse embryonic stem cells in chemically defined medium. Brain Res. Bull. 68, 62-75 - PubMed
- Brodski C., Weisenhorn D. M., Signore M., Sillaber I., Oesterheld M., Broccoli V., Acampora D., Simeone A., Wurst W. (2003). Location and size of dopaminergic and serotonergic cell populations are controlled by the position of the midbrain-hindbrain organizer. J. Neurosci. 23, 4199-4207 - PMC - PubMed
Publication types
MeSH terms
Substances
Grants and funding
- U120005004/MRC_/Medical Research Council/United Kingdom
- MC_U120085817/MRC_/Medical Research Council/United Kingdom
- G117/560/MRC_/Medical Research Council/United Kingdom
- MC_U120085816/MRC_/Medical Research Council/United Kingdom
- U120085816/MRC_/Medical Research Council/United Kingdom
LinkOut - more resources
Full Text Sources
Other Literature Sources
Miscellaneous

