Metformin inhibits melanoma development through autophagy and apoptosis mechanisms - PubMed (original) (raw)
doi: 10.1038/cddis.2011.86.
T Botton, M Cerezo, G Robert, F Luciano, A Puissant, P Gounon, M Allegra, C Bertolotto, J-M Bereder, S Tartare-Deckert, P Bahadoran, P Auberger, R Ballotti, S Rocchi
Affiliations
- PMID: 21881601
- PMCID: PMC3186904
- DOI: 10.1038/cddis.2011.86
Metformin inhibits melanoma development through autophagy and apoptosis mechanisms
T Tomic et al. Cell Death Dis. 2011.
Abstract
Metformin is the most widely used antidiabetic drug because of its proven efficacy and limited secondary effects. Interestingly, recent studies have reported that metformin can block the growth of different tumor types. Here, we show that metformin exerts antiproliferative effects on melanoma cells, whereas normal human melanocytes are resistant to these metformin-induced effects. To better understand the basis of this antiproliferative effect of metformin in melanoma, we characterized the sequence of events underlying metformin action. We showed that 24 h metformin treatment induced a cell cycle arrest in G0/G1 phases, while after 72 h, melanoma cells underwent autophagy as demonstrated by electron microscopy, immunochemistry, and by quantification of the autolysosome-associated LC3 and Beclin1 proteins. In addition, 96 h post metformin treatment we observed robust apoptosis of melanoma cells. Interestingly, inhibition of autophagy by knocking down LC3 or ATG5 decreased the extent of apoptosis, and suppressed the antiproliferative effect of metformin on melanoma cells, suggesting that apoptosis is a consequence of autophagy. The relevance of these observations were confirmed in vivo, as we showed that metformin treatment impaired the melanoma tumor growth in mice, and induced autophagy and apoptosis markers. Taken together, our data suggest that metformin has an important impact on melanoma growth, and may therefore be beneficial in patients with melanoma.
Figures
Figure 1
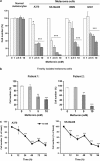
Metformin represses melanoma cell proliferation (a) Primary human melanocytes and melanoma cell lines A375, SKMel28, WM9 and G361 were treated with indicated concentrations of metformin. After 72 h, viable cells were counted using trypan blue dye exclusion method. (b) Human melanoma cells freshly isolated from tumor were stimulated for 72 h with indicated concentrations of metformin. Viability of the cells was estimated by trypan blue staining. (c) A375 and SKMel28 were treated with PBS and 10 mM metformin during different times, and cell viability was determined by trypan blue dye exclusion assay. For each experiment, cell number is expressed in percent of control (100%). Data are mean±S.D. of three independent experiments performed in triplicate. Significantly different from the corresponding control *P<0.05; **P<0.01; ***P<0.001
Figure 2
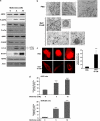
Metformin triggers autophagy in melanoma cells. (a) A375 melanoma cells were treated with indicated concentrations of metformin for 72 h. Cell lysates were separated by SDS-PAGE and analysed by western blot using the indicated antibody. HSP60 and actin were used as loading control. One representative experiment of three is shown. (b) Electron microscopy images presenting ultrastructure in representative control (PBS) and 10 mM metformin-treated melanoma cells for 72 h. Arrowheads, autophagosomes. Nu, nucleus; M, mitochondria. (c) Representative confocal microscopy images of RFP-LC3 staining in melanoma cells expressing RFP-LC3 and stimulated with or without metformin. In parallel (right panel), number of cells with RFP-LC3 dots were scored on 50 transfected cells. (d) Melanoma A375 and SKMel28 cells were incubated without or with metformin for 72 h, and cathepsin B activity was evaluated in the presence or absence of CA-074Me. Results are expressed as arbitrary units (A.U.) per mg of proteins. Data are mean±S.D. of representative experiment performed in triplicate. Significantly different from the corresponding control ***P<0.001
Figure 3
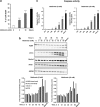
Metformin induces melanoma cell death. (a) A375 melanoma cells were treated with indicated concentrations of metformin for 96 h. Cell death was measured by FACS analysis of propidium iodide uptake and results were expressed as a percentage of effective cell death. Staurosporine was used as a control of cell death. (b) A375 cells were incubated with metformin (5 or 10 mM) for the indicated times or with staurosporine as control of cell death. Cell lysates were separated by SDS-PAGE and analysed by western blot using the indicated antibody. HSP60 was used as loading control. One representative experiment of three is shown. Quantification of western blots were performed using Fuji Film, Multi Gauge. (c) A375 cells were incubated with metformin (5 or 10 mM) for the indicated times or with staurosporine as control of cell death. Caspase 3 activity was measured as indicated in Materials and Methods section. Significantly different from the corresponding control *P<0.05; **P<0.01; ***P<0.001
Figure 4
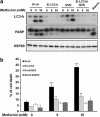
Autophagy is involved in apoptosis and antiproliferative effects of metformin. A375 cells were transfected with either control or LC3b-specific siRNAs. Cells were next preincubated with or without Q-VD-OPH (20 _μ_M) and exposed to metformin (5 or 10 mM) for 96 h. (a) LC3-b expression and PARP cleavage were analyzed by western blotting. HSP60 was used as a loading control. (b) FACS analysis using propidium iodide was used to determine cell death. The results are expressed as percentage of cell death compared with control. Data are expressed as percentage of apoptotic cells and represent the mean±S.D. of six independent experiments. Significantly different from the corresponding control **P<0.01; ***P<0.001
Figure 5
AMP kinase partially mediates cell death induced by metformin in melanoma. A375 cells were transfected with combination of _α_1 and α_2 AMPK siRNAs or with control siRNA. The cells were next treated for 96 h with indicated concentration of metformin. (a) AMPK_α subunit expression, LC3b expression and PARP cleavage were analyzed by western blotting. HSP60 was used as a loading control. Quantification of western blots were performed using Fuji Film, Multi Gauge. (b) FACS analysis using propidium iodide was used to determine cell death. The results are expressed as percentage of cell death compared with control. Data are expressed as percentage of apoptotic cells and represent the mean±S.D. of three independent experiments. Significantly different from the Si-control transfected cells #P<0.05
Figure 6
Effect of metformin on melanoma tumor growth in mice. Female immune-deficient BALB/c nu/nu (nude) mice were inoculated subcutaneously with A375 melanoma cells (2.5 × 10⁶), and after 5 days animals (_n_=6 in each group) were treated with metformin (2 mg/mice/day) or PBS over 3 weeks. (a) The growth tumor curves were determined by measuring the tumor volume. (b) Mice were euthanized and tumors were weighed. *P<0.05; **P<0.01. (c) Frozen sections of tumors from mice treated with PBS or metformin were fixed and stained using LC3-b (green) and DAPI (blue) or using TUNEL assay (green). Slides were examined with a Zeiss Axiophot fluorescence microscope. Representative sections are shown. The experiment was repeated on sections from four mice per condition. Images were treated and analyzed with ImageJ software for LC3 fluorescence quantification using DAPI fluorescence as internal control. LC3 expression and PARP cleavage were analyzed by western blotting. HSP60 was used as a loading control. (d) Female C57BL/6 mice were inoculated subcutaneously with B16F10 melanoma murine cells (2.5 × 10⁵), and after 7 days animals (_n_=6 in each group) were treated with metformin (2 mg/mice/day) or PBS over 3 weeks. Mice were euthanized. The growth of tumors were determined by measuring the tumor volume, and tumors were weighed. Significantly different from the corresponding control *P<0.05; **P<0.01
Similar articles
- A natural BH3 mimetic induces autophagy in apoptosis-resistant prostate cancer via modulating Bcl-2-Beclin1 interaction at endoplasmic reticulum.
Lian J, Wu X, He F, Karnak D, Tang W, Meng Y, Xiang D, Ji M, Lawrence TS, Xu L. Lian J, et al. Cell Death Differ. 2011 Jan;18(1):60-71. doi: 10.1038/cdd.2010.74. Epub 2010 Jun 25. Cell Death Differ. 2011. PMID: 20577262 Free PMC article. - Autophagy blockade sensitizes the anticancer activity of CA-4 via JNK-Bcl-2 pathway.
Li Y, Luo P, Wang J, Dai J, Yang X, Wu H, Yang B, He Q. Li Y, et al. Toxicol Appl Pharmacol. 2014 Jan 15;274(2):319-27. doi: 10.1016/j.taap.2013.11.018. Epub 2013 Dec 7. Toxicol Appl Pharmacol. 2014. PMID: 24321340 - Cisplatin-induced apoptosis inhibits autophagy, which acts as a pro-survival mechanism in human melanoma cells.
Del Bello B, Toscano M, Moretti D, Maellaro E. Del Bello B, et al. PLoS One. 2013;8(2):e57236. doi: 10.1371/journal.pone.0057236. Epub 2013 Feb 20. PLoS One. 2013. PMID: 23437349 Free PMC article. - Oncogenic BRAF inhibitor UAI-201 induces cell cycle arrest and autophagy in BRAF mutant glioma cells.
Ahn JH, Lee YW, Ahn SK, Lee M. Ahn JH, et al. Life Sci. 2014 May 28;104(1-2):38-46. doi: 10.1016/j.lfs.2014.03.026. Epub 2014 Apr 8. Life Sci. 2014. PMID: 24721513 - Mechanisms of cancer cell killing by metformin: a review on different cell death pathways.
Wu XY, Xu WW, Huan XK, Wu GN, Li G, Zhou YH, Najafi M. Wu XY, et al. Mol Cell Biochem. 2023 Jan;478(1):197-214. doi: 10.1007/s11010-022-04502-4. Epub 2022 Jun 30. Mol Cell Biochem. 2023. PMID: 35771397 Review.
Cited by
- Autophagy Modulators in Cancer Therapy.
Buzun K, Gornowicz A, Lesyk R, Bielawski K, Bielawska A. Buzun K, et al. Int J Mol Sci. 2021 May 28;22(11):5804. doi: 10.3390/ijms22115804. Int J Mol Sci. 2021. PMID: 34071600 Free PMC article. Review. - Systemic Oxidative Stress and Visceral Adipose Tissue Mediators of NLRP3 Inflammasome and Autophagy Are Reduced in Obese Type 2 Diabetic Patients Treated with Metformin.
Abad-Jiménez Z, López-Domènech S, Díaz-Rúa R, Iannantuoni F, Gómez-Abril SÁ, Periañez-Gómez D, Morillas C, Víctor VM, Rocha M. Abad-Jiménez Z, et al. Antioxidants (Basel). 2020 Sep 21;9(9):892. doi: 10.3390/antiox9090892. Antioxidants (Basel). 2020. PMID: 32967076 Free PMC article. - Ascorbate Plus Buformin in AML: A Metabolic Targeted Treatment.
Banella C, Catalano G, Travaglini S, Pelosi E, Ottone T, Zaza A, Guerrera G, Angelini DF, Niscola P, Divona M, Battistini L, Screnci M, Ammatuna E, Testa U, Nervi C, Voso MT, Noguera NI. Banella C, et al. Cancers (Basel). 2022 May 23;14(10):2565. doi: 10.3390/cancers14102565. Cancers (Basel). 2022. PMID: 35626170 Free PMC article. - Proliferation and Invasion of Melanoma Are Suppressed by a Plant Protease Inhibitor, Leading to Downregulation of Survival/Death-Related Proteins.
Bonturi CR, Salu BR, Bonazza CN, Sinigaglia RC, Rodrigues T, Alvarez-Flores MP, Chudzinski-Tavassi AM, Oliva MLV. Bonturi CR, et al. Molecules. 2022 May 5;27(9):2956. doi: 10.3390/molecules27092956. Molecules. 2022. PMID: 35566311 Free PMC article. - Inhibition of melanogenesis by the antidiabetic metformin.
Lehraiki A, Abbe P, Cerezo M, Rouaud F, Regazzetti C, Chignon-Sicard B, Passeron T, Bertolotto C, Ballotti R, Rocchi S. Lehraiki A, et al. J Invest Dermatol. 2014 Oct;134(10):2589-2597. doi: 10.1038/jid.2014.202. Epub 2014 Apr 22. J Invest Dermatol. 2014. PMID: 24756109
References
- Demierre MF. Epidemiology and prevention of cutaneous melanoma. Curr Treat Options Oncol. 2006;7:181–186. - PubMed
- Bailey CJ, Turner RC. Metformin. N Engl J Med. 1996;334:574–579. - PubMed
- Hundal HS, Ramlal T, Reyes R, Leiter LA, Klip A. Cellular mechanism of metformin action involves glucose transporter translocation from an intracellular pool to the plasma membrane in L6 muscle cells. Endocrinology. 1992;131:1165–1173. - PubMed
- Stumvoll M, Nurjhan N, Perriello G, Dailey G, Gerich JE. Metabolic effects of metformin in non-insulin-dependent diabetes mellitus. N Engl J Med. 1995;333:550–554. - PubMed
- Lalau JD, Race JM.Lactic acidosis in metformin therapy Drugs 199958(Suppl 155–60.discussion 75–82. - PubMed
Publication types
MeSH terms
Substances
LinkOut - more resources
Full Text Sources
Other Literature Sources


