Hotspots organize clathrin-mediated endocytosis by efficient recruitment and retention of nucleating resources - PubMed (original) (raw)
Hotspots organize clathrin-mediated endocytosis by efficient recruitment and retention of nucleating resources
Daniel Nunez et al. Traffic. 2011 Dec.
Abstract
The formation of clathrin-coated pits (CCPs) at the plasma membrane has been reported to sometimes occur repeatedly at predefined sites. However, defining such CCP 'hotspots' structurally and mechanistically has been difficult due to the dynamic and heterogeneous nature of CCPs. Here, we explore the molecular requirements for hotspots using a global assay of CCP dynamics. Our data confirmed that a subset of CCPs is nucleated at spatially distinct sites. The degree of clustering of nucleation events at these sites is dependent on the integrity of cortical actin, and the availability of certain resources, including the adaptor protein AP-2 and the phospholipid PI(4,5)P(2) . We observe that modulation in the expression level of FCHo1 and 2, which have been reported to initiate CCPs, affects only the number of nucleations. Modulation in the expression levels of other accessory proteins, such as SNX9, affects the spatial clustering of CCPs but not the number of nucleations. On the basis of these findings, we distinguish two classes of accessory proteins in clathrin-mediated endocytosis (CME): nucleation factors and nucleation organizers. Finally, we observe that clustering of transferrin receptors spatially randomizes pit nucleation and thus reduces the role of hotspots. On the basis of these data, we propose that hotspots are specialized cortical actin patches that organize CCP nucleations from within the cell by more efficient recruitment and/or retention of the resources required for CCP nucleation partially due to the action of nucleation organizers.
© 2011 John Wiley & Sons A/S.
Figures
FIGURE 1. CME is organized into hotspots
(A) CCPs in BSC1 cells expressing EGFP-CLCa were visualized with TIR-FM and detected as in (12). Detection results are shown here for a single frame as red dots overlaid on the negative of the image. (B) All CCP nucleation events detected throughout the time lapse are projected onto the footprint of the cell. (C) Simulated point distribution with the same number of points as in B, but in a spatially random distribution. (D) Pair correlation function of all nucleation events averaged over 113 control movies (blue). The function shows a significant increase above the background of a random distribution (black), indicating spatial clustering of nucleation events over a length scale 0 – 300 nm. (E) The pair correlation function of nucleation events was calculated using different observation windows and the maxima of the pair correlation functions were plotted vs. the duration of the observation window. Scale bars: 2 μm.
FIGURE 2. Models of point processes provide insight into the mechanism of hotspot regulation
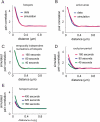
We simulated point processes and measured the pair correlation for these processes. Each simulation consisted of a total of 300 frames of 500 by 500 pixels. A total of 50 curves resulting from 50 iterations of the simulation were averaged to produce the curves displayed here. (A) Our experimental data is best fitted by a model in which 57% of the nucleations occur in invisible hotspots (`parent loci') randomly scattered throughout the frame. Spatially, nucleations were Gaussian-distributed around each parent locus with a full width at half maximum diameter of 268 nm. The remaining 43% points are randomly distributed. (B) Implementation of a spatial nucleation model (active random patches 200 nm in radius whose centers are separated by 400 nm) as described in Ehrlich et al. (9). We find that this model provides a less adequate fit, i.e. a higher sum of squares of the residuals, to the experimental data. (C, D, and E) We measured the pair correlation for different observation periods for a simulation as in (A). (C) Temporal dependencies between pits were modeled by introducing a Poisson-distributed probability for each parent locus to give rise to a nucleation with an expectancy value of 0.0022 nucleations/locus/frame. (D) Hotspots become incompetent for renewed nucleation for 16 s after a nucleation event. (E) Hotspots are forced to turn over after 160 s; to maintain a steady state density of hotspots the disappearance of a hotspot is accompanied by generation of a new hotspot in another location.
FIGURE 3. Hotspots only affect the spatial organization of nucleation events
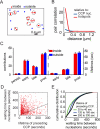
(A) Classification of CCP nucleation events into events occurring inside hotspots (red; hotspot areas indicated by circles) and outside hotspots (blue). (B) (Cross-) Pair correlation function of the different point populations identified in A. The pair correlation of nucleations relative to hotspot centroids (red), and the pair correlation of nucleations with respect to other nucleations (blue) are shown here. (C) Contributions and characteristic lifetime of early abortive, late abortive, and productive CCP populations nucleated inside hotspots and outside hotspots. Error bars indicate standard error of the mean. (D) Waiting times between subsequent nucleation events at each hotspot as a function of the lifetime of the preceding CCP. Statistical data in the text relies on n = 53610 nucleation events. For graphical purposes the data has been randomly subsampled reflecting n'= 1000 events. The black line represents the unity time. Data points below the line indicate nucleation events before termination of the preceding CCP. Data points above the line indicate nucleation events after termination of the preceding CCP. (E) Cumulative histogram of the time elapsed between two consecutive nucleation events in hotspots. Histograms are binned according to the lifetime of the first of the two CCPs.
FIGURE 4. Clustering density of nucleation events depends on the actin cortex and nucleation resources
(A) Normalized nucleation density (number of nucleation events divided by total area of the cell's footprint) and (B) normalized clustering density (integral of the pair correlation function over radius interval (0 – 134 nm) for control cells (n = 23; normalized to group's median), latrunculin treated cells (n = 5; normalized to median of 9 control wild-type cells) and jasplakinolide treated cells (n = 23; normalized to median of 18 control cells). Red bar, median; blue box, range between 25th and 75th percentiles; whiskers, range of data classified as inliers to the distribution. (C) Normalized nucleation density and (D) normalized clustering density for control cells (n = 23; normalized to group's median), cells treated with siRNA for PIP5Kα (n = 19; normalized to the median of 48 non-targeting siRNA treated cells), cells transfected with PIP5Kα tagged with mCherry (n = 23; normalized to the median of 29 cells transfected with mCherry alone), cells treated with PIP2 carried by neomycin (n = 10; normalized to median of 9 control neomycin treated cells), and μ2 (AP-2) siRNA treated cells (n = 14; normalized to median of 9 control wild-type cells). (E) Normalized nucleation density and (F) normalized clustering density for cells treated with non-targeting siRNA (n=8; normalized to group's median), with siRNA against FCHo1/2 (n = 8; normalized to the median of 8 non-targeting siRNA treated cells), and for cells transfected with tagRFP-T-FCHo2 (n = 6; normalized to the median of 10 wild-type cells). (G) Normalized nucleation density and (H) normalized clustering density for cells treated with non-targeting shRNA (n=6; normalized to group's median) and with shRNA against SNX9 (n =8; normalized to the median of 6 non-targeting shRNA treated cells). * is P < 0.05, ** is P < 0.01, *** is P < 0.001 according to paired t-test (see Methods). All conditions where compared to controls from the same user in order to account for user-to-user variability in acquisition conditions.
FIGURE 5. SNX9 is enriched in hotspots prior to CCP nucleation
(A) Average SNX9 intensity trace for CCPs found to nucleate in hotspots (red) is compared to the average SNX9 intensity trace of CCPs found to nucleate outside hotspots (blue), and to the average clathrin intensity trace of all CCPs (black). 678 CCPs (430 hotspot CCPs, 345 outside nucleated CCPs) with a lifetime 60 – 80 s from 7 cells were used. SNX9 intensities were normalized to the maximal average SNX9 intensity of CCPs in hotspots; clathrin intensities were normalized to the maximal average clathrin intensity of the combined population of CCPs inside and outside hotspots. (B) Mean intensity (normalized by same factor as SNX9 traces in A) from 30 s to 6 s before CCP nucleation, and from 6 s to 30 s after CCP internalization for all CCPs (8 – 100 s in lifetime) found to nucleate in hotspots (hotspots), for CCPs that nucleate and remain in hotspots (remain in hotspots), for CCPs that nucleate in and then diffuse away from a hotspot (leave hotspots), and for CCPs that nucleate outside hotspots (random); n = 3797, 2003, 1794, and 3146 CCPs respectively. Error bars represent the standard error of the mean. (C) Average FCHo2 and clathrin intensities for CCPs with a lifetime 60 – 80 s (2606 hotspot CCPs, 1682 outside nucleated CCPs from 6 cells were used). (D) Average AP-2 (σ2-EGFP) and clathrin intensities for CCPs with a lifetime 60 – 80 s (1038 hotspot CCPs, 483 outside nucleated CCPs from 8 cells were used). AP-2 and FCHo2 intensity traces were normalized in the same manner as SNX9. SNX9, AP-2, and FCHo2 intensity traces in the background were obtained by sampling random partner intensity traces for each CCP at a distance of 134 nm.
FIGURE 6. Clustering cargo reduces CCP clustering
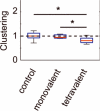
Clustering was measured for cells expressing biotinylated transferrin receptor and treated with a tetrameric streptavidin cargo in which each monomer contains a mutation and cannot bind biotin (control, n = 14), in which only one monomer can bind biotin (monovalent, n = 9), and in which all four monomers can bind biotin (tetravalent, n = 12). All conditions were normalized to the median of the cargo the control. * is P < 0.05 according to paired t-test (see Methods). Red bar, median; blue box, range between 25th and 75th percentiles; whiskers, range of data classified as inliers to the distribution.
Similar articles
- Local clustering of transferrin receptors promotes clathrin-coated pit initiation.
Liu AP, Aguet F, Danuser G, Schmid SL. Liu AP, et al. J Cell Biol. 2010 Dec 27;191(7):1381-93. doi: 10.1083/jcb.201008117. J Cell Biol. 2010. PMID: 21187331 Free PMC article. - Wbox2: A clathrin terminal domain-derived peptide inhibitor of clathrin-mediated endocytosis.
Chen Z, Mino RE, Mettlen M, Michaely P, Bhave M, Reed DK, Schmid SL. Chen Z, et al. J Cell Biol. 2020 Sep 7;219(9):e201908189. doi: 10.1083/jcb.201908189. J Cell Biol. 2020. PMID: 32520988 Free PMC article. - Cargo regulates clathrin-coated pit dynamics.
Puthenveedu MA, von Zastrow M. Puthenveedu MA, et al. Cell. 2006 Oct 6;127(1):113-24. doi: 10.1016/j.cell.2006.08.035. Cell. 2006. PMID: 17018281 - Evolving models for assembling and shaping clathrin-coated pits.
Chen Z, Schmid SL. Chen Z, et al. J Cell Biol. 2020 Sep 7;219(9):e202005126. doi: 10.1083/jcb.202005126. J Cell Biol. 2020. PMID: 32770195 Free PMC article. Review. - Understanding living clathrin-coated pits.
Rappoport JZ, Simon SM, Benmerah A. Rappoport JZ, et al. Traffic. 2004 May;5(5):327-37. doi: 10.1111/j.1398-9219.2004.00187.x. Traffic. 2004. PMID: 15086782 Review.
Cited by
- Cell spreading area regulates clathrin-coated pit dynamics on micropatterned substrate.
Tan X, Heureaux J, Liu AP. Tan X, et al. Integr Biol (Camb). 2015 Sep;7(9):1033-43. doi: 10.1039/c5ib00111k. Epub 2015 Jul 24. Integr Biol (Camb). 2015. PMID: 26205141 Free PMC article. - Morphological changes of plasma membrane and protein assembly during clathrin-mediated endocytosis.
Yoshida A, Sakai N, Uekusa Y, Imaoka Y, Itagaki Y, Suzuki Y, Yoshimura SH. Yoshida A, et al. PLoS Biol. 2018 May 3;16(5):e2004786. doi: 10.1371/journal.pbio.2004786. eCollection 2018 May. PLoS Biol. 2018. PMID: 29723197 Free PMC article. - Endocytosis and the internalization of pathogenic organisms: focus on phosphoinositides.
Walpole GFW, Grinstein S. Walpole GFW, et al. F1000Res. 2020 May 15;9:F1000 Faculty Rev-368. doi: 10.12688/f1000research.22393.1. eCollection 2020. F1000Res. 2020. PMID: 32494357 Free PMC article. Review. - Loss of PTEN promotes formation of signaling-capable clathrin-coated pits.
Rosselli-Murai LK, Yates JA, Yoshida S, Bourg J, Ho KKY, White M, Prisby J, Tan X, Altemus M, Bao L, Wu ZF, Veatch SL, Swanson JA, Merajver SD, Liu AP. Rosselli-Murai LK, et al. J Cell Sci. 2018 Apr 26;131(8):jcs208926. doi: 10.1242/jcs.208926. J Cell Sci. 2018. PMID: 29588397 Free PMC article. - Enhanced receptor-clathrin interactions induced by N-glycan-mediated membrane micropatterning.
Torreno-Pina JA, Castro BM, Manzo C, Buschow SI, Cambi A, Garcia-Parajo MF. Torreno-Pina JA, et al. Proc Natl Acad Sci U S A. 2014 Jul 29;111(30):11037-42. doi: 10.1073/pnas.1402041111. Epub 2014 Jul 16. Proc Natl Acad Sci U S A. 2014. PMID: 25030450 Free PMC article.
References
- Brett TJ, Traub LM. Molecular structures of coat and coat-associated proteins: function follows form. Curr Opin Cell Biol. 2006;18:395–406. - PubMed
- Conner SD, Schmid SL. Regulated portals of entry into the cell. Nature. 2003;422:37–44. - PubMed
- Kirchhausen T, Clathrin Annu Rev Biochem. 2000;69:699–727. - PubMed
- Schoch S, Gundelfinger ED. Molecular organization of the presynaptic active zone. Cell Tissue Res. 2006;326:379–391. - PubMed
- Owald D, Sigrist SJ. Assembling the presynaptic active zone. Curr Opin Neurobiol. 2009;19:311–318. - PubMed
Publication types
MeSH terms
Substances
LinkOut - more resources
Full Text Sources
Molecular Biology Databases
Research Materials
Miscellaneous


