Chloroplast genome variation in upland and lowland switchgrass - PubMed (original) (raw)
Chloroplast genome variation in upland and lowland switchgrass
Hugh A Young et al. PLoS One. 2011.
Abstract
Switchgrass (Panicum virgatum L.) exists at multiple ploidies and two phenotypically distinct ecotypes. To facilitate interploidal comparisons and to understand the extent of sequence variation within existing breeding pools, two complete switchgrass chloroplast genomes were sequenced from individuals representative of the upland and lowland ecotypes. The results demonstrated a very high degree of conservation in gene content and order with other sequenced plastid genomes. The lowland ecotype reference sequence (Kanlow Lin1) was 139,677 base pairs while the upland sequence (Summer Lin2) was 139,619 base pairs. Alignments between the lowland reference sequence and short-read sequence data from existing sequence datasets identified as either upland or lowland confirmed known polymorphisms and indicated the presence of other differences. Insertions and deletions principally occurred near stretches of homopolymer simple sequence repeats in intergenic regions while most Single Nucleotide Polymorphisms (SNPs) occurred in intergenic regions and introns within the single copy portions of the genome. The polymorphism rate between upland and lowland switchgrass ecotypes was found to be similar to rates reported between chloroplast genomes of indica and japonica subspecies of rice which were believed to have diverged 0.2-0.4 million years ago.
Conflict of interest statement
Competing Interests: The authors have declared that no competing interests exist.
Figures
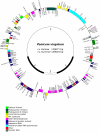
Figure 1. Map of the chloroplast genome of P. virgatum cv. Kanlow Lin1.
The thick lines of the inner circle indicate the locations of the inverted repeats (IRb and IRa) which separate the SSC and LSC regions. Genes on the outside of the map are transcribed in a counter-clockwise direction and those on the inside are transcribed clockwise. Genes containing introns are marked with exon numbers (e.g. ycf3.e2). Transfer RNAs are indicated by gray bars.
Figure 2. MultiPip analysis showing sequence similarity of cp genomes.
(A) MultiPipMaker was used to align the two switchgrass cp genomes. There is a 21 bp insertion in rpoC2 of Summer Lin2. (B) MultiPip alignment of cp genomes from members of Poales demonstrates sequence similarity, indicated by red (75–100%), green (50–75%), and white (<50%). The earliest diverging member, Typha latifolia, is used as the reference genome. Arrows indicate gene losses and/or IR expansions occurring in switchgrass Lin1 and Lin2 cp genomes. Regions of the cp genome are indicated across the top (LSC, IRb, SSC, IRa).
Figure 3. Mononucleotide microsatellite length polymorphisms in Kanlow Lin1.
(A) The total incidence of mononucleotide repeats is indicated based on repeat length (bp) and location in the plastid genome. (B) The rates of homopolymer incidence per kb are indicated for each genomic region. IR – inverted repeat; LSC – long single copy; SSC – short single copy.
Figure 4. Overlap and classification of Single Nucleotide Polymorphisms (SNPs) and Insertion/Deletion (InDel) differences.
Illumina RNAseq data from upland and lowland genotypes were aligned to the Lin1 reference sequence. (A) Overlap of SNPs identified within 1.53 million Illumina sequences that aligned from pooled upland genotypes (Up) and 82,656 Illumina sequences from pooled lowland (Low) genotypes with SNPs identified within the Lin2 reference genome. Numbers in red indicate the total of both variable and invariant differences that were detected. (B) The variant positions within the Illumina data were aggregated and summarized by position and by type of variation. TN, transition; TV, transversion; indel, insertion/deletion.
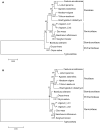
Figure 5. Phylogenetic Analyses.
An aligned data set of 61 protein-coding genes from 15 taxa of the order Poales was used for phylogenetic analyses. The evolutionary history was inferred using the Maximum Parsimony (A) and Maximum Likelihood (B) methods. The percentage of replicate trees in which the associated taxa clustered together in the bootstrap tests (500 replicates) are shown next to the branches. There were a total of 41,397 positions in the final dataset. Evolutionary analyses were conducted in MEGA5 . All positions containing gaps and missing data were eliminated. Subfamily groupings are indicated by solid lines on the right margin.
Similar articles
- Hierarchical classification of switchgrass genotypes using SSR and chloroplast sequences: ecotypes, ploidies, gene pools, and cultivars.
Zalapa JE, Price DL, Kaeppler SM, Tobias CM, Okada M, Casler MD. Zalapa JE, et al. Theor Appl Genet. 2011 Mar;122(4):805-17. doi: 10.1007/s00122-010-1488-1. Epub 2010 Nov 23. Theor Appl Genet. 2011. PMID: 21104398 - Diversity and population structure of northern switchgrass as revealed through exome capture sequencing.
Evans J, Crisovan E, Barry K, Daum C, Jenkins J, Kunde-Ramamoorthy G, Nandety A, Ngan CY, Vaillancourt B, Wei CL, Schmutz J, Kaeppler SM, Casler MD, Buell CR. Evans J, et al. Plant J. 2015 Nov;84(4):800-15. doi: 10.1111/tpj.13041. Plant J. 2015. PMID: 26426343 - Nucleotide polymorphism and copy number variant detection using exome capture and next-generation sequencing in the polyploid grass Panicum virgatum.
Evans J, Kim J, Childs KL, Vaillancourt B, Crisovan E, Nandety A, Gerhardt DJ, Richmond TA, Jeddeloh JA, Kaeppler SM, Casler MD, Buell CR. Evans J, et al. Plant J. 2014 Sep;79(6):993-1008. doi: 10.1111/tpj.12601. Epub 2014 Aug 11. Plant J. 2014. PMID: 24947485 Free PMC article. - Natural variation in genes potentially involved in plant architecture and adaptation in switchgrass (Panicum virgatum L.).
Bahri BA, Daverdin G, Xu X, Cheng JF, Barry KW, Brummer EC, Devos KM. Bahri BA, et al. BMC Evol Biol. 2018 Jun 14;18(1):91. doi: 10.1186/s12862-018-1193-2. BMC Evol Biol. 2018. PMID: 29898656 Free PMC article. - A Region on Chromosome 7 Related to Differentiation of Rice (Oryza sativa L.) Between Lowland and Upland Ecotypes.
Uddin MN, Fukuta Y. Uddin MN, et al. Front Plant Sci. 2020 Jul 27;11:1135. doi: 10.3389/fpls.2020.01135. eCollection 2020. Front Plant Sci. 2020. PMID: 32849696 Free PMC article. Review.
Cited by
- Genomic diversity in switchgrass (Panicum virgatum): from the continental scale to a dune landscape.
Morris GP, Grabowski PP, Borevitz JO. Morris GP, et al. Mol Ecol. 2011 Dec;20(23):4938-52. doi: 10.1111/j.1365-294X.2011.05335.x. Epub 2011 Nov 8. Mol Ecol. 2011. PMID: 22060816 Free PMC article. - Plastid Genotyping Reveals the Uniformity of Cytoplasmic Male Sterile-T Maize Cytoplasms.
Bosacchi M, Gurdon C, Maliga P. Bosacchi M, et al. Plant Physiol. 2015 Nov;169(3):2129-37. doi: 10.1104/pp.15.01147. Epub 2015 Sep 2. Plant Physiol. 2015. PMID: 26336091 Free PMC article. - The dynamic evolution of mobile open reading frames in plastomes of Hymenophyllum Sm. and new insight on Hymenophyllum coreanum Nakai.
Kim HT, Kim JS. Kim HT, et al. Sci Rep. 2020 Jul 6;10(1):11059. doi: 10.1038/s41598-020-68000-7. Sci Rep. 2020. PMID: 32632087 Free PMC article. - Complete chloroplast genome of Sedum sarmentosum and chloroplast genome evolution in Saxifragales.
Dong W, Xu C, Cheng T, Zhou S. Dong W, et al. PLoS One. 2013 Oct 18;8(10):e77965. doi: 10.1371/journal.pone.0077965. eCollection 2013. PLoS One. 2013. PMID: 24205047 Free PMC article. - Synergistic and antagonistic effects of salinity and pH on germination in switchgrass (Panicum virgatum L.).
Liu Y, Wang Q, Zhang Y, Cui J, Chen G, Xie B, Wu C, Liu H. Liu Y, et al. PLoS One. 2014 Jan 14;9(1):e85282. doi: 10.1371/journal.pone.0085282. eCollection 2014. PLoS One. 2014. PMID: 24454834 Free PMC article.
References
- Vogel KP, Dien BS, Jung HG, Casler MD, Masterson SD, et al. Quantifying actual and theoretical ethanol yields for switchgrass strains using NIRS analyses. Bioenerg Res. 2010;4:96–110. doi: 10.1007/s12155-010-9104-4. - DOI
- Sarath G, Mitchell RB, Sattler SE, Funnell D, Pedersen JF, et al. Opportunities and roadblocks in utilizing forages and small grains for liquid fuels. J Ind Microbiol Biot. 2008;35:343–354. doi: 10.1007/s10295-007-0296-3. - DOI - PubMed
- Sanderson MA, Adler PR, Boateng AA, Casler MD, Sarath G. Switchgrass as a biofuels feedstock in the USA. Can J Plant Sci. 2006;86:1315–1325.
- Rubin EM. Genomics of cellulosic biofuels. Nature. 2008;454:841–845. doi: 10.1038/nature07190. - DOI - PubMed
- Porter CL. An analysis of variation between upland and lowland switchgrass, Panicum virgatum L., in central Oklahoma. Ecology. 1966;47:980. doi: 10.2307/1935646. - DOI
Publication types
MeSH terms
LinkOut - more resources
Full Text Sources
Molecular Biology Databases


