BET bromodomain inhibition as a therapeutic strategy to target c-Myc - PubMed (original) (raw)
. 2011 Sep 16;146(6):904-17.
doi: 10.1016/j.cell.2011.08.017. Epub 2011 Sep 1.
Ghayas C Issa, Madeleine E Lemieux, Peter B Rahl, Junwei Shi, Hannah M Jacobs, Efstathios Kastritis, Timothy Gilpatrick, Ronald M Paranal, Jun Qi, Marta Chesi, Anna C Schinzel, Michael R McKeown, Timothy P Heffernan, Christopher R Vakoc, P Leif Bergsagel, Irene M Ghobrial, Paul G Richardson, Richard A Young, William C Hahn, Kenneth C Anderson, Andrew L Kung, James E Bradner, Constantine S Mitsiades
Affiliations
- PMID: 21889194
- PMCID: PMC3187920
- DOI: 10.1016/j.cell.2011.08.017
BET bromodomain inhibition as a therapeutic strategy to target c-Myc
Jake E Delmore et al. Cell. 2011.
Abstract
MYC contributes to the pathogenesis of a majority of human cancers, yet strategies to modulate the function of the c-Myc oncoprotein do not exist. Toward this objective, we have targeted MYC transcription by interfering with chromatin-dependent signal transduction to RNA polymerase, specifically by inhibiting the acetyl-lysine recognition domains (bromodomains) of putative coactivator proteins implicated in transcriptional initiation and elongation. Using a selective small-molecule bromodomain inhibitor, JQ1, we identify BET bromodomain proteins as regulatory factors for c-Myc. BET inhibition by JQ1 downregulates MYC transcription, followed by genome-wide downregulation of Myc-dependent target genes. In experimental models of multiple myeloma, a Myc-dependent hematologic malignancy, JQ1 produces a potent antiproliferative effect associated with cell-cycle arrest and cellular senescence. Efficacy of JQ1 in three murine models of multiple myeloma establishes the therapeutic rationale for BET bromodomain inhibition in this disease and other malignancies characterized by pathologic activation of c-Myc.
Copyright © 2011 Elsevier Inc. All rights reserved.
Figures
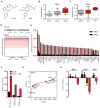
Figure 1. Integrated genomic rationale for BET bromodomains as therapeutic targets in MM
(A) Structures of the BET bromodomain inhibitors JQ1 and iBET. (B,C) Expression levels (log2 transformed, median-centered values) for BRD4 transcripts were evaluated in oligonucleotide microarray data from normal plasma cells (NPCs) from healthy donors, individuals with MGUS or SMM patients (panel B, dataset GSE5900, (Zhan et al., 2007)); and in plasma cells from MGUS, MM and PCL patients (panel C, dataset GSE2113 (Mattioli et al., 2005)). Increased BRD4 expression is observed in SMM (or MGUS) compared to NPCs (panel B) and in PCL compared to MM (panel C) (non-parametric Kruskal-Wallis one-way analysis of variance p< 0.001 and p=0.0123, respectively; Dunn’s Multiple Comparison post-hoc tests p<0.05, in both cases). (D) Copy number analysis of the BRD4 locus at human chromosome 19p13.1 in primary samples from 254 MM patients. Chromosome 19p amplifications are common in MM (Figure S1). (E) Expression levels of BRD4 (compared to BRDT) in human MM cell lines. Asterisks denote cell lines with amplification of the BRD4 locus (19p13.1). (F) BRD4 expression (depicted on a linear scale for three different oligonucleotide microarray probes) in INA-6 MM cells cultured in vitro in the presence or absence of HS-5 bone marrow stromal cells. (G) Silencing of BET bromodomains impairs proliferation in MM cells. Results of an arrayed lentiviral screen using a diverse shRNA library in INA-6 MM cells are presented in rank order of ascending B-Scores. The effect of shRNAs targeting BET bromodomains on INA-6 cell viability is highlighted by red circles and annotated by gene. Gray dots represent results for non-BET bromodomain shRNAs. (H) Silencing of BET bromodomain family members in MM cells. Viability of INA-6 MM cells exposed to shRNAs directed against BRD2, BRD3 and BRD4 are reported as mean B-scores (±SD of the two normalized replicates).
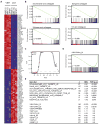
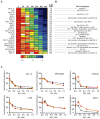
Figure 2. Inhibition of Myc-dependent transcription by the JQ1 BET bromodomain inhibitor
(A) Heat map representation of the top 50 down- and top 50 up-regulated genes (P < 0.001) following JQ1 treatment in MM cell lines. Data are presented row-normalized (range from -3- to +3-fold change in expression). MYC (arrow) is downregulated by JQ1 treatment. (B) GSEA of four Myc-dependent gene sets (Kim et al., 2006; Schlosser et al., 2005; Schuhmacher et al., 2001; Zeller et al., 2003), in transcriptional profiles of MM cells treated (left) or untreated (right) with JQ1. (C) Quantitative comparison of all transcription factor target gene sets available from the MSigDB by GSEA for reduced expression in JQ1-treated MM cell lines. Data are presented as scatterplot of false discovery rate (FDR) versus normalized enrichment score (NES) for each evaluated gene set. Colored dots indicate gene sets for MYC (red), E2F (black), or other (gray) transcription factors. (D) GSEA showing downregulation, in JQ1-treated MM cells, of a representative set of genes with proximal promoter regions containing Myc-Max binding sites. (E) Table of gene sets enriched among genes downregulated by JQ1 in MM cells (top group), highlighting the number of genes in each set (n), the normalized enrichment score (NES) and test of statistical significance (FDR q-value). The bottom group represents comparisons of top-ranking transcription factor target gene sets of MM master regulatory proteins, enriched among genes downregulated by JQ1 in MM cells.
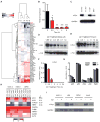
Figure 3. BET inhibition suppresses MYC transcription in MM
(A) Heatmap of cancer-related genes expressed in MM cells (MM.1S), treated with JQ1 (500 nM over 1, 4 and 8 h). MYC (red) is downregulated by JQ1 in a time-dependent manner, uniquely among all oncogenes studied (230 total). MYC was identified as the only statistically significant decrease in transcription at all four time-points analyzed (p < 0.05). (B) Quantitative RT-PCR analysis for MYC levels in JQ1-treated MM.1S cells (500 nM, 0 - 8 h). Data are presented as ratio of MYC expression at each time-point compared to baseline MYC expression. Asterisks denote the level of statistical significance (* p < 0.01, ** p < 0.0002, *** p < 0.006; paired Student’s t-test each relative to t = 0 h). (C) The active JQ1 enantiomer and the structurally analogous BET inhibitor, iBET (Nicodeme et al., 2010), but not the inactive (-)-JQ1 enantiomer, downregulate c-Myc expression, as determined by immunoblotting of MM.1S cells treated with compounds (500 nM) or vehicle control for 24 h. (D-E) Immunoblotting analyses of the (D) dose- and (E) time-dependent effects of JQ1 treatment on c-Myc expression in MM.1S cells. (F-G) Selective depletion of nuclear c-Myc following JQ1 treatment (500 nM) as measured by ELISA-based DNA binding assays for the activity of (F) c-Myc (depleted after 1-2 h) and (G) NF-κB family members (unaffected). Data represent mean ± SEM. (H) Heatmap of clustered gene expression data from multiplexed measurement (Nanostring) of cancer-associated genes in three human MM cell lines treated with JQ1 or vehicle control. Among 230 genes studied (Figure S4), four genes (MYC, TERT, TYRO3 and MYB) exhibited statistically significant (p<0.05) downregulation. Replicate expression measurements exhibited high concordance among low and highly expressed genes (Figure S3B). (I) Immunoblotting study of four MM lines (KMS11, LR5, OPM1, and INA-6) identifies a JQ1-induced decrease in c-Myc expression (500 nM, 24 h).
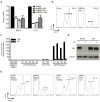
Figure 4. Regulation of MYC transcription by BET bromodomains
(A) BRD4 and MYC expression in OPM1 cells transduced with either shBRD4 (three different hairpins) or a Renilla control hairpin (shRluc). shRNAs were induced for five days before analysis by qRT-PCR. Data were normalized to GAPDH. (B). Cell cycle analysis of OPM1 cells transduced with the indicated shRNA for six days. BrdU staining (APC) identifies the fraction of cells in S-phase. (C) ChIP studiesof BRD4 (anti-BRD4; Bethyl) binding to MYC TSS or proximal enhancers in MM.1S cells. Competitive displacement of BRD4 from IgH enhancers is observed upon treatment with JQ1 (500nM for 24 h; red bars) compared to vehicle control (black bars). (D) Immunolotting of whole-cell lysates from empty MSCV vector- or Myc overexpression vector-transduced OPM1 cells after treating with JQ1 (500nM, 24h) or DMSO control. (E) Cell cycle analysis of either empty or Myc over-expressing OPM1 cells treated with JQ1 (500nM, 24h). BrdU staining (APC) identifies the fraction of cells in S-phase.
Figure 5. Anti-myeloma activity of JQ1 in vitro
(A) A panel of MM cell lines was tested for in vitro sensitivity to JQ1 (12.5 - 800 nM, 72h), by measurement of ATP levels (Cell TiterGlo; Promega). (B) MYC genomic status of selected MM cell lines from panel A, as annotated (Dib et al., 2008). (C) Activity of JQ1 against MM cell lines cultured in the presence (red lines) or absence (black lines) of the HS-5 stromal cell line, assessed by CS-BLI (McMillin et al., 2010).
Figure 6. JQ1 induces cell cycle arrest and cellular senescence in MM cells
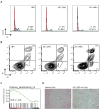
(A-B) Flow cytometric evaluation of propidium iodide (PI) staining for cell cycle analysis (panel A) and detection of Annexin V-positive apoptotic cells (panel B) in JQ1-treated MM.1S cells (0 - 48hrs, 500 nM). (C) Enrichment of senescence-associated genes among JQ1-suppressed genes in MM.1S cells. (D) Induction of cellular senescence in JQ1 treated MM.1S cells (500 nM, 72 h), as detected by ß-galactosidase staining.
Figure 7. Translational implications of BET bromodomain inhibition in MM
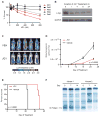
(A) JQ1 arrests the proliferation of primary, patient-derived CD138+ MM cells (Cell TiterGlo; Promega). (B) c-Myc immunoblot shows JQ1-induced downregulation in short-term culture of primary, patient-derived MM cells (500 nM, duration as indicated). (C) Representative whole-body bioluminescence images of SCID-beige mice orthotopically xenografted after intravenous injection with MM.1S-luc+ cells and treated with JQ1 (50 mg/kg IP daily) or vehicle control. (D) Tumor burden of SCID-beige mice orthotopically xenografted after intravenous injection with MM.1S-luc+ cells. Upon detection of MM lesions diffusely engrafted in the skeleton, mice were randomly assigned to receive JQ1 (50 mg/kg IP daily) or vehicle control. Data are presented as mean +/- SEM (n = 10/group). (E) Survival curves (Kaplan-Meier) of mice with orthotopic diffuse MM lesions show prolongation of overall survival with JQ1 treatment compared to vehicle control (log-rank test, p < 0.0001). (F) Serum protein electrophoresis to detect monoclonal, tumor-derived, immunoglobulin (M-protein) in two MM-bearing Vk*myc mice before or after 7 and 14 days of JQ1 treatment. JQ1 treatment induced partial and complete responses, respectively, in mouse 1 and mouse 2.
Comment in
- Targeting MYC? You BET.
Alderton GK. Alderton GK. Nat Rev Cancer. 2011 Sep 23;11(10):693. doi: 10.1038/nrc3147. Nat Rev Cancer. 2011. PMID: 21941280 No abstract available. - Targeting MYC? You BET.
Alderton GK. Alderton GK. Nat Rev Drug Discov. 2011 Sep 30;10(10):732-3. doi: 10.1038/nrd3569. Nat Rev Drug Discov. 2011. PMID: 21959283 No abstract available.
Similar articles
- Efficacy of BET bromodomain inhibition in Kras-mutant non-small cell lung cancer.
Shimamura T, Chen Z, Soucheray M, Carretero J, Kikuchi E, Tchaicha JH, Gao Y, Cheng KA, Cohoon TJ, Qi J, Akbay E, Kimmelman AC, Kung AL, Bradner JE, Wong KK. Shimamura T, et al. Clin Cancer Res. 2013 Nov 15;19(22):6183-92. doi: 10.1158/1078-0432.CCR-12-3904. Epub 2013 Sep 17. Clin Cancer Res. 2013. PMID: 24045185 Free PMC article. - BET bromodomain inhibition of MYC-amplified medulloblastoma.
Bandopadhayay P, Bergthold G, Nguyen B, Schubert S, Gholamin S, Tang Y, Bolin S, Schumacher SE, Zeid R, Masoud S, Yu F, Vue N, Gibson WJ, Paolella BR, Mitra SS, Cheshier SH, Qi J, Liu KW, Wechsler-Reya R, Weiss WA, Swartling FJ, Kieran MW, Bradner JE, Beroukhim R, Cho YJ. Bandopadhayay P, et al. Clin Cancer Res. 2014 Feb 15;20(4):912-25. doi: 10.1158/1078-0432.CCR-13-2281. Epub 2013 Dec 2. Clin Cancer Res. 2014. PMID: 24297863 Free PMC article. - Replication Study: BET bromodomain inhibition as a therapeutic strategy to target c-Myc.
Aird F, Kandela I, Mantis C; Reproducibility Project: Cancer Biology. Aird F, et al. Elife. 2017 Jan 19;6:e21253. doi: 10.7554/eLife.21253. Elife. 2017. PMID: 28100400 Free PMC article. - Bromodomains: Structure, function and pharmacology of inhibition.
Ferri E, Petosa C, McKenna CE. Ferri E, et al. Biochem Pharmacol. 2016 Apr 15;106:1-18. doi: 10.1016/j.bcp.2015.12.005. Epub 2015 Dec 18. Biochem Pharmacol. 2016. PMID: 26707800 Review. - Defeating MYC with drug combinations or dual-targeting drugs.
Thompson PE, Shortt J. Thompson PE, et al. Trends Pharmacol Sci. 2024 Jun;45(6):490-502. doi: 10.1016/j.tips.2024.04.008. Epub 2024 May 22. Trends Pharmacol Sci. 2024. PMID: 38782688 Review.
Cited by
- c-Myc and cancer metabolism.
Miller DM, Thomas SD, Islam A, Muench D, Sedoris K. Miller DM, et al. Clin Cancer Res. 2012 Oct 15;18(20):5546-53. doi: 10.1158/1078-0432.CCR-12-0977. Clin Cancer Res. 2012. PMID: 23071356 Free PMC article. - Resistance to BET inhibitors in lung adenocarcinoma is mediated by casein kinase phosphorylation of BRD4.
Calder J, Nagelberg A, Luu J, Lu D, Lockwood WW. Calder J, et al. Oncogenesis. 2021 Mar 12;10(3):27. doi: 10.1038/s41389-021-00316-z. Oncogenesis. 2021. PMID: 33712563 Free PMC article. - The BET bromodomain inhibitor JQ1 activates HIV latency through antagonizing Brd4 inhibition of Tat-transactivation.
Li Z, Guo J, Wu Y, Zhou Q. Li Z, et al. Nucleic Acids Res. 2013 Jan 7;41(1):277-87. doi: 10.1093/nar/gks976. Epub 2012 Oct 18. Nucleic Acids Res. 2013. PMID: 23087374 Free PMC article. - BRD4 methylation by the methyltransferase SETD6 regulates selective transcription to control mRNA translation.
Vershinin Z, Feldman M, Werner T, Weil LE, Kublanovsky M, Abaev-Schneiderman E, Sklarz M, Lam EYN, Alasad K, Picaud S, Rotblat B, McAdam RA, Chalifa-Caspi V, Bantscheff M, Chapman T, Lewis HD, Filippakopoulos P, Dawson MA, Grandi P, Prinjha RK, Levy D. Vershinin Z, et al. Sci Adv. 2021 May 26;7(22):eabf5374. doi: 10.1126/sciadv.abf5374. Print 2021 May. Sci Adv. 2021. PMID: 34039605 Free PMC article. - Pharmacogenomics for immunotherapy and immune-related cardiotoxicity.
Castrillon JA, Eng C, Cheng F. Castrillon JA, et al. Hum Mol Genet. 2020 Oct 20;29(R2):R186-R196. doi: 10.1093/hmg/ddaa137. Hum Mol Genet. 2020. PMID: 32620943 Free PMC article. Review.
References
- Amati B, Brooks MW, Levy N, Littlewood TD, Evan GI, Land H. Oncogenic activity of the c-Myc protein requires dimerization with Max. Cell. 1993;72:233–245. - PubMed
- Bidwell GL, 3rd, Davis AN, Raucher D. Targeting a c-Myc inhibitory polypeptide to specific intracellular compartments using cell penetrating peptides. J Control Release. 2009;135:2–10. - PubMed
- Blackwood EM, Eisenman RN. Max: a helix-loop-helix zipper protein that forms a sequence-specific DNA-binding complex with Myc. Science. 1991;251:1211–1217. - PubMed
Publication types
MeSH terms
Substances
Grants and funding
- R01CA46455/CA/NCI NIH HHS/United States
- R01 CA136671/CA/NCI NIH HHS/United States
- R01 CA136671-04/CA/NCI NIH HHS/United States
- R01 HG002668-08/HG/NHGRI NIH HHS/United States
- R01 CA050947/CA/NCI NIH HHS/United States
- R01 CA133966/CA/NCI NIH HHS/United States
- WT_/Wellcome Trust/United Kingdom
- R01CA050947/CA/NCI NIH HHS/United States
- R01HG002668/HG/NHGRI NIH HHS/United States
- R01 AG020686-08/AG/NIA NIH HHS/United States
- R01 AG020686/AG/NIA NIH HHS/United States
- K08 CA128972-04/CA/NCI NIH HHS/United States
- K08CA128972/CA/NCI NIH HHS/United States
- R01 CA133966-04/CA/NCI NIH HHS/United States
- K08 CA128972/CA/NCI NIH HHS/United States
- R01 HG002668/HG/NHGRI NIH HHS/United States
LinkOut - more resources
Full Text Sources
Other Literature Sources
Medical
Miscellaneous
