PATRIC: the comprehensive bacterial bioinformatics resource with a focus on human pathogenic species - PubMed (original) (raw)
Review
. 2011 Nov;79(11):4286-98.
doi: 10.1128/IAI.00207-11. Epub 2011 Sep 6.
Alice R Wattam, Stephen A Cammer, Joseph L Gabbard, Maulik P Shukla, Oral Dalay, Timothy Driscoll, Deborah Hix, Shrinivasrao P Mane, Chunhong Mao, Eric K Nordberg, Mark Scott, Julie R Schulman, Eric E Snyder, Daniel E Sullivan, Chunxia Wang, Andrew Warren, Kelly P Williams, Tian Xue, Hyun Seung Yoo, Chengdong Zhang, Yan Zhang, Rebecca Will, Ronald W Kenyon, Bruno W Sobral
Affiliations
- PMID: 21896772
- PMCID: PMC3257917
- DOI: 10.1128/IAI.00207-11
Review
PATRIC: the comprehensive bacterial bioinformatics resource with a focus on human pathogenic species
Joseph J Gillespie et al. Infect Immun. 2011 Nov.
Abstract
Funded by the National Institute of Allergy and Infectious Diseases, the Pathosystems Resource Integration Center (PATRIC) is a genomics-centric relational database and bioinformatics resource designed to assist scientists in infectious-disease research. Specifically, PATRIC provides scientists with (i) a comprehensive bacterial genomics database, (ii) a plethora of associated data relevant to genomic analysis, and (iii) an extensive suite of computational tools and platforms for bioinformatics analysis. While the primary aim of PATRIC is to advance the knowledge underlying the biology of human pathogens, all publicly available genome-scale data for bacteria are compiled and continually updated, thereby enabling comparative analyses to reveal the basis for differences between infectious free-living and commensal species. Herein we summarize the major features available at PATRIC, dividing the resources into two major categories: (i) organisms, genomes, and comparative genomics and (ii) recurrent integration of community-derived associated data. Additionally, we present two experimental designs typical of bacterial genomics research and report on the execution of both projects using only PATRIC data and tools. These applications encompass a broad range of the data and analysis tools available, illustrating practical uses of PATRIC for the biologist. Finally, a summary of PATRIC's outreach activities, collaborative endeavors, and future research directions is provided.
Figures
Fig. 1.
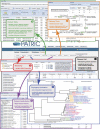
Schema depicting major genomic and comparative genomic tools available from an organism “Overview” homepage. This example illustrates the Rickettsia genomes compiled at PATRIC. The “Genome List” (box 1) provides statistics across three different annotation methods (RAST, legacy BRC, and RefSeq), with each genome linked to an interactive genome browser tool. The “Taxonomy” page (box 2) provides classification schemes from the NCBI taxonomy database, taxonomic identifiers specific to each organism used to associate related data across the website. The “Phylogeny” page (box 3) demonstrates the precomputed trees estimated for higher-level groups (typically at the order level), which are based on concatenated alignments of conserved protein families. Each “Locus Tag” leads to unique pages for each CDS that provide links to NCBI (corresponding RefSeq locus tags), FASTA-formatted protein and nucleotide files, Uniprot mapping data for proteins, and direct interaction with the genome browser tool. The “Protein Families” page (box 5) lists the SEED-derived FIGfams (31) generated for any selection of genomes using the genome filter tool. An interactive heat map visualization tool gives a bird's-eye view of both protein distribution across multiple genomes and relative conservation of synteny (see Fig.3A). Finally, the “Pathways” page (box 6) provides the metabolic pathways that are encoded within a selected taxon, integrating information from the Kyoto Encyclopedia of Genes and Genomes (KEGG) (33). All pathways can be visualized for each of the three different annotation methods, and pathway conservation across multiple genomes can be evaluated.
Fig. 2.
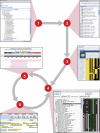
Experimental design for evaluating the conservation and distribution of erythritol catabolic and transport genes across 107 Rhizobiales genomes. Steps 1 to 4 illustrate the functionality of the PATRIC Protein Family Sorter (PFS) tool. (Step 1) From either the “Taxonomy Tree” or the “Genome List,” any number of genomes can be selected for analysis. (Step 2) The “Genome Filter” tool allows the evaluation of FIGfam membership (e.g., present or absent in all selected genomes, patchy distribution across genomes), and an “Advanced Filter” tool enables the retrieval of more refined FIGfam lists based on specific terms (e.g., “Product Descriptions,” “Perfect Families,” and/or the number of proteins or genomes per protein family). (Step 3) The interactive “Protein Family Heat-map” provides an overview of the distribution of proteins across a selected set of genomes. A reference genome can be selected to anchor the display of the protein families, and each individual column or row within the heat map can be moved to adjust the display. All protein sequences for each FIGfam can be extracted from the heat map in a variety a ways (see “Protein Family Heatmap FAQs”). (Step 4) Once a FIGfam is captured, proteins can be selected and evaluated using the “Integrated Protein Tree and Alignment” option. This displays the sequences in the “Multiple Sequence Alignment Viewer” tool, which combines an estimated phylogeny (left) with the full sequence alignment (right). (Step 5) Using BLAST tools within PATRIC, full-length sequences from the alignment can be used as queries in searches against all genomes for sequences not included within the FIGfam, such as highly divergent proteins, split ORFs, and truncations (BLASTP) and pseudogenes not annotated as CDSs in the genomes (TBLASTN). (S6) For sequences detected outside the FIGfam, the “Genome Browser” tool can be used to evaluate potential pseudogenes (i.e., validation of point and frameshift mutations) as well as areas of low sequence coverage or poor quality. Steps 4 to 6 can be iterative in evaluating the relative conservation of a protein family across a set of diverse genomes.
Fig. 3.
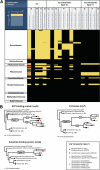
Phylogenomic analysis of erythritol catabolic and transport genes across 107 Rhizobiales genomes. These results summarize the comparative genomics experimental design, which primarily utilizes the PATRIC Protein Family Sorter (PFS) tool (Fig.2). (A) Heat map depiction of the distribution of erythritol catabolic (_eryA_-D) and transport (hypothetical lipoprotein [hlp] and eryE-G) proteins. The x axis of the map lists the annotated Ery protein families (simplified at top), with individual components (including duplications and split CDSs) enclosed within black boxes. The y axis shows the genomes, with taxon names simplified and arranged at the family level. Black regions indicate no representative proteins assigned to the protein family; bright yellow regions indicate one representative protein assigned to the protein family. Other colors depict multiple representatives per protein family, with increasing membership ranging from dark yellow to dark orange. (B) Phylogenetic analysis of the type 2 and type 1 ery transport proteins. Alignments, performed using MUSCLE v3.6 (17, 18), and generated trees, estimated using FastTree v.2 (34), were visualized simultaneously using the PATRIC Multiple Sequence Alignment Viewer (see Fig. S2C in the supplemental material). The phylograms for EryE, EryF, and EryG are simplifications of the larger trees and depict the evolution of type 1 transporter components from the type 2 family. Smaller gray circles illustrate the duplication of the type 1 components into type 1-1 and type 1-2 (EryE and EryF only). All taxa encoding type 1 components are represented with colored circles, which are explained in the inset at bottom right.
Fig. 4.
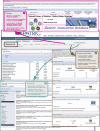
Schema depicting the integrated community-derived associated data available from an organism “Overview” homepage. Navigation from the Helicobacter “Genome List” (outlined in black) is illustrated. Disease information (box 1) can be summarized into four main categories: Literature (PubMed article compilation and MeSH terms for database searching [32]), virulence factors (data from the Virulence Factor Database [VFDB] [54] is used to identify all putative homologs present within other bacterial genomes), human genes associated with disease (Genetic Association Database [8, 57] and Comparative Toxicogenomics Database [14]), and disease-pathogen data (interactive graphics for relationships between pathogens, diseases, virulence genes, and disease-associated host genes, as well as interactive global health maps [11] illustrating recent reports and outbreaks of bacterial diseases). “Experimental Data” (box 2) encompasses transcriptomic data (GEO [6, 7], ArrayExpress [26], and Proteomics Resource Centers [PRCs] [56]), proteomics data from mass spectrometry (Peptidome [25], PRIDE [48] and the PRCs), protein-protein interaction data from the PRCs and IntACt (4), and protein 3-D structure data from NCBI and Protein Data Bank (PDB) (10). “Literature” (box 3) is primarily comprised of a recurrent compilation of literature and web text resources pertaining to each organism (PubMed abstracts and links to articles), with a search tool that allows filtering by keywords, dates, etc. An integrated text-mining tool (UK National Text Mining Centre [NaCTeM]) allows efficient recall of relevant documents through the identification of key entities from the search text (i.e., genes, proteins, metabolites, drugs, diseases, symptoms, etc.).
Similar articles
- Comparative genomic analysis at the PATRIC, a bioinformatic resource center.
Wattam AR, Gabbard JL, Shukla M, Sobral BW. Wattam AR, et al. Methods Mol Biol. 2014;1197:287-308. doi: 10.1007/978-1-4939-1261-2_17. Methods Mol Biol. 2014. PMID: 25172288 - PATRIC, the bacterial bioinformatics database and analysis resource.
Wattam AR, Abraham D, Dalay O, Disz TL, Driscoll T, Gabbard JL, Gillespie JJ, Gough R, Hix D, Kenyon R, Machi D, Mao C, Nordberg EK, Olson R, Overbeek R, Pusch GD, Shukla M, Schulman J, Stevens RL, Sullivan DE, Vonstein V, Warren A, Will R, Wilson MJ, Yoo HS, Zhang C, Zhang Y, Sobral BW. Wattam AR, et al. Nucleic Acids Res. 2014 Jan;42(Database issue):D581-91. doi: 10.1093/nar/gkt1099. Epub 2013 Nov 12. Nucleic Acids Res. 2014. PMID: 24225323 Free PMC article. - Curation, integration and visualization of bacterial virulence factors in PATRIC.
Mao C, Abraham D, Wattam AR, Wilson MJ, Shukla M, Yoo HS, Sobral BW. Mao C, et al. Bioinformatics. 2015 Jan 15;31(2):252-8. doi: 10.1093/bioinformatics/btu631. Epub 2014 Sep 30. Bioinformatics. 2015. PMID: 25273106 Free PMC article. - Assembly, Annotation, and Comparative Genomics in PATRIC, the All Bacterial Bioinformatics Resource Center.
Wattam AR, Brettin T, Davis JJ, Gerdes S, Kenyon R, Machi D, Mao C, Olson R, Overbeek R, Pusch GD, Shukla MP, Stevens R, Vonstein V, Warren A, Xia F, Yoo H. Wattam AR, et al. Methods Mol Biol. 2018;1704:79-101. doi: 10.1007/978-1-4939-7463-4_4. Methods Mol Biol. 2018. PMID: 29277864 Review. - An Experimental Approach to Genome Annotation: This report is based on a colloquium sponsored by the American Academy of Microbiology held July 19-20, 2004, in Washington, DC.
[No authors listed] [No authors listed] Washington (DC): American Society for Microbiology; 2004. Washington (DC): American Society for Microbiology; 2004. PMID: 33001599 Free Books & Documents. Review.
Cited by
- The PhoP/PhoQ system and its role in Serratia marcescens pathogenesis.
Barchiesi J, Castelli ME, Di Venanzio G, Colombo MI, García Véscovi E. Barchiesi J, et al. J Bacteriol. 2012 Jun;194(11):2949-61. doi: 10.1128/JB.06820-11. Epub 2012 Mar 30. J Bacteriol. 2012. PMID: 22467788 Free PMC article. - High-Throughput Screen for Cell Wall Synthesis Network Module in Mycobacterium tuberculosis Based on Integrated Bioinformatics Strategy.
Luo X, Pan J, Meng Q, Huang J, Wang W, Zhang N, Wang G. Luo X, et al. Front Bioeng Biotechnol. 2020 Jun 30;8:607. doi: 10.3389/fbioe.2020.00607. eCollection 2020. Front Bioeng Biotechnol. 2020. PMID: 32695753 Free PMC article. - BacMap: an up-to-date electronic atlas of annotated bacterial genomes.
Cruz J, Liu Y, Liang Y, Zhou Y, Wilson M, Dennis JJ, Stothard P, Van Domselaar G, Wishart DS. Cruz J, et al. Nucleic Acids Res. 2012 Jan;40(Database issue):D599-604. doi: 10.1093/nar/gkr1105. Epub 2011 Dec 1. Nucleic Acids Res. 2012. PMID: 22135301 Free PMC article. - Role of the normal gut microbiota.
Jandhyala SM, Talukdar R, Subramanyam C, Vuyyuru H, Sasikala M, Nageshwar Reddy D. Jandhyala SM, et al. World J Gastroenterol. 2015 Aug 7;21(29):8787-803. doi: 10.3748/wjg.v21.i29.8787. World J Gastroenterol. 2015. PMID: 26269668 Free PMC article. Review. - A New Gene Family Diagnostic for Intracellular Biomineralization of Amorphous Ca Carbonates by Cyanobacteria.
Benzerara K, Duprat E, Bitard-Feildel T, Caumes G, Cassier-Chauvat C, Chauvat F, Dezi M, Diop SI, Gaschignard G, Görgen S, Gugger M, López-García P, Millet M, Skouri-Panet F, Moreira D, Callebaut I. Benzerara K, et al. Genome Biol Evol. 2022 Mar 2;14(3):evac026. doi: 10.1093/gbe/evac026. Genome Biol Evol. 2022. PMID: 35143662 Free PMC article.
References
Publication types
MeSH terms
LinkOut - more resources
Full Text Sources
Medical


