Obesity resistance and increased hepatic expression of catabolism-related mRNAs in Cnot3+/- mice - PubMed (original) (raw)
Obesity resistance and increased hepatic expression of catabolism-related mRNAs in Cnot3+/- mice
Masahiro Morita et al. EMBO J. 2011.
Abstract
Obesity is a life-threatening factor and is often associated with dysregulation of gene expression. Here, we show that the CNOT3 subunit of the CCR4-NOT deadenylase complex is critical to metabolic regulation. Cnot3(+/-) mice are lean with hepatic and adipose tissues containing reduced levels of lipids, and show increased metabolic rates and enhanced glucose tolerance. Cnot3(+/-) mice remain lean and sensitive to insulin even on a high-fat diet. Furthermore, introduction of Cnot3 haplodeficiency in ob/ob mice ameliorated the obese phenotype. Hepatic expression of most mRNAs is not altered in Cnot3(+/-) vis-à-vis wild-type mice. However, the levels of specific mRNAs, such as those coding for energy metabolism-related PDK4 and IGFBP1, are increased in Cnot3(+/-) hepatocytes, having poly(A) tails that are longer than those seen in control cells. We provide evidence that CNOT3 is involved in recruitment of the CCR4-NOT deadenylase to the 3' end of specific mRNAs. Finally, as CNOT3 levels in the liver and white adipose tissues decrease upon fasting, we propose that CNOT3 responds to feeding conditions to regulate deadenylation-specific mRNAs and energy metabolism.
Conflict of interest statement
The authors declare that they have no conflict of interest.
Figures
Figure 1
Leanness and reduced lipid content in Cnot3+/− mice. (A) Expression of Cnot3 mRNA in mouse tissue. A membrane filter containing mRNAs from multiple mouse tissues (Clontech) was hybridized with a probe specific for Cnot3. _Actin_-specific probe was used as a loading control. (B) Immunoblotting of CNOT3, CNOT6L, CNOT7, and CNOT1 protein in the Cnot3+/− livers. (C) Gross appearance of 2-week-old Cnot3+/− mice and wild-type littermates. (D) Growth curve of wild-type and Cnot3+/− mice from 3 to 8 weeks after birth. _n_=10 for each genotype. (E) Comparison of body weight (left) and body length (right) of 12-week-old Cnot3+/− mice and wild-type littermates. (F) The relative weight of the indicated organs. The weight of the organ was normalized to body weight. _n_=8–10 for each genotype. (G) Lipid levels in the liver. (Left panel) Liver triglyceride levels of 12-week-old wild-type and Cnot3+/− mice. Triglycerides in the homogenized liver were extracted with 2-propanol and measured with a Triglyceride E-Test Kit. _n_=5 for each genotype. (Right panel) Sudan Black B staining of liver sections from 12-week-old wild-type and Cnot3+/− mice. (H) Histological analysis of and cell size distribution in epididymal WATs of 12-week-old wild-type and Cnot3+/− mice. (I) Histological analysis of BATs of 12-week-old wild-type and Cnot3+/− mice. All values represent mean±s.e.m. *P<0.05; **P<0.01 and ***P<0.001.
Figure 2
Increased glucose homeostasis, insulin sensitivity, and metabolic rates in Cnot3+/− mice. (A) Average daily food intake normalized to body weight. Daily food intake per mouse was measured over 7 days. _n_=10 for each genotype. (B, C) Oxygen consumption (VO2) over 24 h (B) and average VO2 (C) of wild-type and Cnot3+/− mice. The data were normalized to body weight0.75. _n_=5 for each genotype. (D) Rectal temperatures of wild-type and Cnot3+/− mice. _n_=5 for each genotype. (E–G) Blood tests. Blood glucose levels (E), serum triglyceride concentrations (F), and serum insulin concentrations (G) in fed or fasted wild-type and Cnot3+/− mice. _n_=6–13 for each genotype. (H, I) Glucose tolerance tests. Mice were deprived of food for 16 h before the experiment. Blood glucose levels (H) and serum insulin levels (I) in wild-type and Cnot3+/− mice were measured at the indicated times following intraperitoneal injection of glucose. _n_=8–10 for each genotype. (J) Insulin tolerance tests. Blood glucose levels in wild-type and Cnot3+/− mice were measured at the indicated times following intraperitoneal injection of insulin. _n_=12 for each genotype. (K) Immunoblotting of phospho (Ser-473) and total Akt protein in the liver and WAT of wild-type and Cnot3+/− mice, with or without insulin stimulation. *Unspecific signals. All values represent mean±s.e.m. *P<0.05 and **P<0.01.
Figure 3
Resistance to diet-induced obesity and related metabolic disorder in Cnot3+/− mice. (A) Gross appearance of 20-week-old Cnot3+/− mice and their wild-type littermates after HFD feeding. (B) Growth curves of wild-type and Cnot3+/− mice during HFD feeding. _n_=16–20 for each genotype. HFD feeding started at 8 weeks of age. (C) Changes in body weight of wild-type and Cnot3+/− mice. _n_=16–20 for each genotype. (D) The relative weights of the indicated organs from wild-type and Cnot3+/− mice. _n_=6 for each genotype. (E) Histological analysis of the liver, epididymal WATs, and BATs of wild-type and Cnot3+/− mice. (F) Liver morphology of wild-type and Cnot3+/− mice at the end of HFD feeing. (G) CT scan analysis of wild-type and Cnot3+/− mice. (H) Blood glucose levels of wild-type and Cnot3+/− mice after 16 h of HFD feeding or fasting at the end of the HFD feeding. _n_=9–10 for each genotype. (I, J) Glucose and insulin tolerance tests. Blood glucose levels in wild-type and Cnot3+/− mice were measured at each indicated time point following intraperitoneal injection of glucose or insulin. _n_=8–10 for each genotype. All values represent mean±s.e.m. *P<0.05; **P<0.01 and **P<0.01.
Figure 4
Improvement of obesity and insulin resistance in ob/ob;Cnot3+/− mice. (A) Increased expression of CNOT3 in the liver of ob/ob mice. Immunoblotting of CNOT3 and CNOT6L in wild-type and ob/ob mice (left), and quantification of the data (right). Levels were normalized to α-tubulin. _n_=3 for each genotype. (B) Decreased body weight in 12-week-old ob/ob,Cnot3+/− mice. _n_=10 for ob/ob mice. _n_=4 for ob/ob,Cnot3+/− mice. (C, D) Glucose (C) and insulin (D) tolerance tests. Blood glucose levels were measured at each indicated time point following intraperitoneal glucose or insulin injection. _n_=6 for ob/ob mice. _n_=4 for ob/ob,Cnot3+/− mice. (E–H) Comparison of average VO2 (E), respiratory quotient (F), locomotor activity (G), and average daily food intake (H) between ob/ob and ob/ob,Cnot3+/− mice. VO2 were normalized to body weight0.75. Respiratory quotient was calculated by carbon dioxide production/oxygen consumption. Daily food intake per mouse was measured over 7 days. All values represent mean±s.e.m. *P<0.05; **P<0.01 and ***P<0.001.
Figure 5
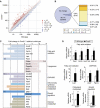
Deadenylase regulates genes involved in metabolism in the liver. (A) A scatter plot of mRNA expression values in the livers isolated from 12-week-old wild-type (x axis) and Cnot3+/− (y axis) mice. _n_=2 for each genotype. (B) A proportion of each group was categorized as a fraction of the fold change in Cnot3+/− livers relative to wild-type livers. Genes displaying a fold change of −1.5 to +1.5 were considered within the normal range. (C) Fold change in expression values of genes related to fatty acid oxidation, lipogenesis, oxidative phosphorylation (OXPHOS), ketone body synthesis, cholesterol metabolism, growth regulation, and glucose metabolism from the microarray data shown in (A) and listed in Supplementary Figure S2. (D) Real-time PCR analysis of selected genes involved in fatty acid oxidation, oxidative phosphorylation, cholesterol metabolism, and growth regulation in the livers of wild-type and Cnot3+/− mice. Hprt mRNA levels were used for normalization. _n_=3–5 for each genotype. All values represent mean±s.e.m. *P<0.05 and **P<0.01.
Figure 6
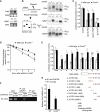
CNOT3 reduction affects the poly(A) tail length of mRNAs involved in lipid metabolism and growth. (A) Northern blot of Igfbp1 and Pdk4 mRNAs from the livers of wild-type and Cnot3+/− mice. (B) Comparison of the poly(A) tail lengths of the Pdk4, Igfbp1, and Gapdh mRNAs between wild-type and Cnot3+/− mice. RNAs were prepared from the livers. The experimental procedure (left) and northern blot data (right) are presented. Completely deadenylated mRNAs were prepared by RNase H treatment in the presence of oligo(dT). Estimated length of the poly(A) tails is indicated on the right of each panel. (C) Luciferase assay with reporter plasmids harbouring the 3′UTRs of Pdk4, Igfbp1, or Lpl mRNA in wild-type and Cnot3+/− hepatocytes. _n_=3 for each genotype. (D) Half-life of the reporter mRNA. Wild-type and Cnot3+/− hepatocytes transfected with a reporter plasmid harbouring the 3′UTR of Pdk4 mRNA were incubated with actinomycin D (5 μg/ml) for the indicated time length. The level of the reporter mRNA was determined by the qPCR method and normalized to that of Hprt mRNA, and plotted semilogarithmically. (E) Luciferase assay (top) with reporter plasmids (bottom) harbouring the various segments of Pdk4 3′UTR in wild-type and Cnot3+/− hepatocytes. ARE, GRE, and possible miRNA-binding sites were indicated. miRanda-mirSVR algorithm provided by microRNA.org was used for the possible miRNA-binding site. (F) Association of CNOT3 with the 3′UTR of Pdk4 mRNA. Cell lysates from HepG2 cells transfected with the reporter plasmids harbouring the 3′UTR of Pdk4 were immunoprecipitated with anti-CNOT3 and control-IgG antibodies. The immunoprecipitates were analysed by RT–PCR using primers specific for the Firefly luciferase mRNA. (G) Association of CNOT6L with Pdk4 mRNA in a CNOT3-dependent manner. Proteins in the hepatocyte lysates prepared from wild-type and Cnot3+/− mice were immunoprecipitated with the monoclonal anti-CNOT6L and control-IgG antibodies. RT–PCR analysis of the immunoprecipitates was performed with primers specific to Pdk4 mRNA. All values represent mean±s.e.m. *P<0.05.
Figure 7
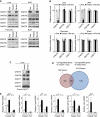
Alternation of CNOT3 expression level by responding to nutrient status and identification of CNOT3-regulated mRNAs. (A) Reduced expression of CNOT3 in the liver and WAT of fasted mice. Western blots of CNOT3 and other CCR4–NOT subunits expression in the liver, WAT, brain, and pancreas of mice fed ad libitum, 24 h fasted, and 24 h re-fed. (B) Quantification of the data is shown in (A). _Ad libitum_-fed, open columns; 24 h fasted, filled columns; and 24 h re-fed mice, semifilled columns. Levels were normalized to α-tubulin. _n_=3 for each condition. All values are mean±s.e.m. *P<0.01 versus fed mice. (C) Levels of CNOTs in the CCR4–NOT complex. Immunoblotting of the anti-CNOT7 immunoprecipitates prepared from the liver of mice fed ad libitum, 24 h fasted and 24 h re-fed. (D) Identification of genes regulated by CNOT3. Global gene expression profiling of liver RNAs was assessed for 8-week-old mice. Note that the data shown in Figure 5 were from the analysis of 12-week-old mice. Comparisons were made between wild-type and Cnot3+/− mice (circled red) and between feeding and fasted wild-type mice (circled blue). (E) Real-time PCR analysis of selected genes in the livers of 8-week-old wild-type and Cnot3+/− mice under fasting or feeding conditions (_n_=3–5 for each genotype). Data represent mean values±s.e.m. *P<0.05; **P<0.01 and ***P<0.001.
Similar articles
- Postnatal liver functional maturation requires Cnot complex-mediated decay of mRNAs encoding cell cycle and immature liver genes.
Suzuki T, Kikuguchi C, Nishijima S, Nagashima T, Takahashi A, Okada M, Yamamoto T. Suzuki T, et al. Development. 2019 Feb 15;146(4):dev168146. doi: 10.1242/dev.168146. Development. 2019. PMID: 30733279 Free PMC article. - CNOT3 suppression promotes necroptosis by stabilizing mRNAs for cell death-inducing proteins.
Suzuki T, Kikuguchi C, Sharma S, Sasaki T, Tokumasu M, Adachi S, Natsume T, Kanegae Y, Yamamoto T. Suzuki T, et al. Sci Rep. 2015 Oct 6;5:14779. doi: 10.1038/srep14779. Sci Rep. 2015. PMID: 26437789 Free PMC article. - CNOT3-Dependent mRNA Deadenylation Safeguards the Pluripotent State.
Zheng X, Yang P, Lackford B, Bennett BD, Wang L, Li H, Wang Y, Miao Y, Foley JF, Fargo DC, Jin Y, Williams CJ, Jothi R, Hu G. Zheng X, et al. Stem Cell Reports. 2016 Nov 8;7(5):897-910. doi: 10.1016/j.stemcr.2016.09.007. Epub 2016 Oct 13. Stem Cell Reports. 2016. PMID: 27746116 Free PMC article. - Multihormonal control of ob gene expression and leptin secretion from cultured human visceral adipose tissue: increased responsiveness to glucocorticoids in obesity.
Halleux CM, Servais I, Reul BA, Detry R, Brichard SM. Halleux CM, et al. J Clin Endocrinol Metab. 1998 Mar;83(3):902-10. doi: 10.1210/jcem.83.3.4644. J Clin Endocrinol Metab. 1998. PMID: 9506746 Review. - Clinical aspects of leptin.
Sinha MK, Caro JF. Sinha MK, et al. Vitam Horm. 1998;54:1-30. doi: 10.1016/s0083-6729(08)60919-x. Vitam Horm. 1998. PMID: 9529971 Review.
Cited by
- The Ccr4-Not complex regulates TORC1 signaling and mitochondrial metabolism by promoting vacuole V-ATPase activity.
Chen H, Miller PW, Johnson DL, Laribee RN. Chen H, et al. PLoS Genet. 2020 Oct 16;16(10):e1009046. doi: 10.1371/journal.pgen.1009046. eCollection 2020 Oct. PLoS Genet. 2020. PMID: 33064727 Free PMC article. - The CCR4-NOT complex is a tumor suppressor in Drosophila melanogaster eye cancer models.
Vicente C, Stirparo R, Demeyer S, de Bock CE, Gielen O, Atkins M, Yan J, Halder G, Hassan BA, Cools J. Vicente C, et al. J Hematol Oncol. 2018 Aug 25;11(1):108. doi: 10.1186/s13045-018-0650-0. J Hematol Oncol. 2018. PMID: 30144809 Free PMC article. - Multifunctional roles of the mammalian CCR4-NOT complex in physiological phenomena.
Shirai YT, Suzuki T, Morita M, Takahashi A, Yamamoto T. Shirai YT, et al. Front Genet. 2014 Aug 21;5:286. doi: 10.3389/fgene.2014.00286. eCollection 2014. Front Genet. 2014. PMID: 25191340 Free PMC article. Review. - Translation efficiency driven by CNOT3 subunit of the CCR4-NOT complex promotes leukemogenesis.
Ghashghaei M, Liu Y, Ettles J, Bombaci G, Ramkumar N, Liu Z, Escano L, Miko SS, Kim Y, Waldron JA, Do K, MacPherson K, Yuen KA, Taibi T, Yue M, Arsalan A, Jin Z, Edin G, Karsan A, Morin GB, Kuchenbauer F, Perna F, Bushell M, Vu LP. Ghashghaei M, et al. Nat Commun. 2024 Mar 15;15(1):2340. doi: 10.1038/s41467-024-46665-2. Nat Commun. 2024. PMID: 38491013 Free PMC article. - Structure and RNA-binding properties of the Not1-Not2-Not5 module of the yeast Ccr4-Not complex.
Bhaskar V, Roudko V, Basquin J, Sharma K, Urlaub H, Séraphin B, Conti E. Bhaskar V, et al. Nat Struct Mol Biol. 2013 Nov;20(11):1281-8. doi: 10.1038/nsmb.2686. Epub 2013 Oct 13. Nat Struct Mol Biol. 2013. PMID: 24121231
References
- Averous J, Maurin AC, Bruhat A, Jousse C, Arliguie C, Fafournoux P (2005) Induction of IGFBP-1 expression by amino acid deprivation of HepG2 human hepatoma cells involves both a transcriptional activation and an mRNA stabilization due to its 3′UTR. FEBS Lett 579: 2609–2614 - PubMed
Publication types
MeSH terms
Substances
LinkOut - more resources
Full Text Sources
Medical
Molecular Biology Databases
Miscellaneous


