The tumor suppressor adenomatous polyposis coli controls the direction in which a cell extrudes from an epithelium - PubMed (original) (raw)
The tumor suppressor adenomatous polyposis coli controls the direction in which a cell extrudes from an epithelium
Thomas W Marshall et al. Mol Biol Cell. 2011 Nov.
Abstract
Despite high rates of cell death, epithelia maintain intact barriers by squeezing dying cells out using a process termed cell extrusion. Cells can extrude apically into the lumen or basally into the tissue the epithelium encases, depending on whether actin and myosin contract at the cell base or apex, respectively. We previously found that microtubules in cells surrounding a dying cell target p115 RhoGEF to the actin cortex to control where contraction occurs. However, what controls microtubule targeting to the cortex and whether the dying cell also controls the extrusion direction were unclear. Here we find that the tumor suppressor adenomatous polyposis coli (APC) controls microtubule targeting to the cell base to drive apical extrusion. Whereas wild-type cells preferentially extrude apically, cells lacking APC or expressing an oncogenic APC mutation extrude predominantly basally in cultured monolayers and zebrafish epidermis. Thus APC is essential for driving extrusion apically. Surprisingly, although APC controls microtubule reorientation and attachment to the actin cortex in cells surrounding the dying cell, it does so by controlling actin and microtubules within the dying cell. APC disruptions that are common in colon and breast cancer may promote basal extrusion of tumor cells, which could enable their exit and subsequent migration.
Figures
FIGURE 1:
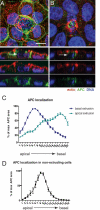
APC localization during apical (A) and basal (B) extrusion. Confocal projections and XZ sections below indicate that APC (green) localizes to the basolateral surface during apical extrusion and to the apical surface during basal extrusion. (C) Quantification. Red, actin; blue, DNA; white arrows, extruding cell. APC localization in nonextruding cells is predominantly apical (D). Scale bar, 10 μm.
FIGURE 2:
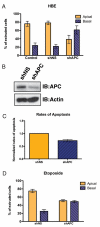
Depletion of APC biases cells to extrude basally. (A) Quantification of cell extrusion events of HBE cells or HBE cells that express either a nonspecific shRNA (shNS) or an shRNA that targets APC transcripts (shAPC). p < 0.001 by Student's t test comparing control or shNS to shAPC. (B) Western blots of HBE shNS or shAPC cell lysates for APC or actin (control). (C) Monolayers of HBE cells expressing either shNS or shAPC were exposed to UV irradiation. After 2 h, cells were fixed and immunostained for active caspase-3. The number of apoptotic cells from five representative fields was counted. N = 3. p = 0.014 by Student's t test. (D) Quantification of cell extrusion events of HBE cells expressing either shNS or shAPC, where apoptosis is induced by exposure to 10 μM etoposide for 6 h. p < 0.001 by Student's t test.
FIGURE 3:
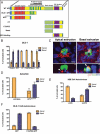
Cells expressing an oncogenic, truncated form of APC extrude basally in a cell autonomous manner. (A) Depiction of APC domains. (B) Quantification of cell extrusion events for DLD-1 cells or DLD-1 cells expressing GFP, CT, CTΔPDZ, basic, or EB1-binding domains. p < 0.001 by Student's t test comparing GFP to CT, CTΔPDZ, basic, or EB1-binding domains. (C) Representative images of either apical or basal extrusions from wild-type or APCmcr/mcr zebrafish epidermis (bars, 10 μm). (D) Quantification, where p < 0.001 by Student's t test comparing wild-type to APCmcr/mcr. (E) Quantification of cell autonomous extrusion events of HBE shNS or shAPC cells. p < 0.001 by Student's t test comparing shNS to shAPC. (F) Quantification of cell autonomous extrusion events of DLD-1 GFP or CTΔPDZ cells. p < 0.001 by Student's t test comparing GFP to CTΔPDZ. Error bar, SEM.
FIGURE 4:
APC and microtubules reciprocally regulate each other during extrusion. (A) Deconvolved images of microtubules (MT) in either HBE or DLD-1 cells surrounding an extruding cell (asterisk). (B) Confocal images of microtubules in either wild-type or APCmcr/mcr zebrafish epidermal cells surrounding an apically and basally extruding cell (asterisk), respectively. (C) Quantification of extrusion frequency of DLD-1 cells or cells expressing CT treated with DMSO (control) or 10 μM nocodazole. There is no significant difference between DLD-1 control and nocodazole-treated cells. p < 0.001 by Student's t test comparing CT to CT + nocodazole. (D) Localization of APC in HBE cells during apical and basal extrusion and around dying cells when microtubules are blocked with nocodazole. N = 10 for each condition. (E) APC localization in DLD-1 cells during basal extrusions with and without nocodazole. N = 9 for each condition. Error bars, SEM (F) Confocal image of F-actin (red) and microtubules (MT) (green) during extrusion of HBE shNS- or shAPC-expressing cells. (G) Confocal image of F-actin (red) and microtubules (MT) (green) during extrusion of DLD-1 GFP-expressing or CT-GFP–expressing cells. (F) Confocal image of F-actin (red) and microtubule (green) during extrusion of HBE shNS- or shAPC-expressing cells. (G) Confocal image of F-actin (red) and microtubules (MT) (green) during extrusion of DLD-1 GFP-expressing or CT-GFP–expressing cells.
FIGURE 5:
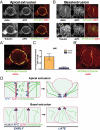
APC colocalizes with both F-actin and microtubules at sites of contraction only during apical extrusion. Immunofluorescence of F-actin (top) or tubulin (middle) with APC during apical (A) or basal extrusion (B). Colocalization of APC/F-actin/tubulin (green) at sites of contraction (red) (bottom, A′ and B′). (C) Quantification of the colocalization of APC/F-actin/tubulin at the contractile ring. p < 0.01 by Student's t test comparing colocalization of these proteins during apical and basal extrusion. N = 8 for each condition. (D) Model of extrusion in wild-type APC (left) or truncated APC epithelial monolayers (right). In wild-type cells, APC controls microtubule dynamics, which in turn targets APC basolaterally, where it promotes actomyosin contraction. This contraction causes microtubules in the neighboring cells to target the basolateral surface and activate contraction, reinforcing apical extrusion. In APC-mutant cells, microtubules are less stable and cannot target APC to the base of the cell. As a result, apical contraction occurs, leading to basal extrusion.
Similar articles
- P115 RhoGEF and microtubules decide the direction apoptotic cells extrude from an epithelium.
Slattum G, McGee KM, Rosenblatt J. Slattum G, et al. J Cell Biol. 2009 Sep 7;186(5):693-702. doi: 10.1083/jcb.200903079. Epub 2009 Aug 31. J Cell Biol. 2009. PMID: 19720875 Free PMC article. - Adenomatous polyposis coli nucleates actin assembly to drive cell migration and microtubule-induced focal adhesion turnover.
Juanes MA, Bouguenina H, Eskin JA, Jaiswal R, Badache A, Goode BL. Juanes MA, et al. J Cell Biol. 2017 Sep 4;216(9):2859-2875. doi: 10.1083/jcb.201702007. Epub 2017 Jun 29. J Cell Biol. 2017. PMID: 28663347 Free PMC article. - Epithelial cell extrusion: Pathways and pathologies.
Gudipaty SA, Rosenblatt J. Gudipaty SA, et al. Semin Cell Dev Biol. 2017 Jul;67:132-140. doi: 10.1016/j.semcdb.2016.05.010. Epub 2016 May 19. Semin Cell Dev Biol. 2017. PMID: 27212253 Free PMC article. Review. - Amer2 protein interacts with EB1 protein and adenomatous polyposis coli (APC) and controls microtubule stability and cell migration.
Pfister AS, Hadjihannas MV, Röhrig W, Schambony A, Behrens J. Pfister AS, et al. J Biol Chem. 2012 Oct 12;287(42):35333-35340. doi: 10.1074/jbc.M112.385393. Epub 2012 Aug 16. J Biol Chem. 2012. PMID: 22898821 Free PMC article. - Adenomatous Polyposis Coli (APC) in cell migration.
Fang X, Svitkina TM. Fang X, et al. Eur J Cell Biol. 2022 Jun-Aug;101(3):151228. doi: 10.1016/j.ejcb.2022.151228. Epub 2022 Apr 22. Eur J Cell Biol. 2022. PMID: 35483122 Free PMC article. Review.
Cited by
- Biological mechanisms underlying structural changes induced by colorectal field carcinogenesis measured with low-coherence enhanced backscattering (LEBS) spectroscopy.
Mutyal NN, Radosevich A, Tiwari AK, Stypula Y, Wali R, Kunte D, Roy HK, Backman V. Mutyal NN, et al. PLoS One. 2013;8(2):e57206. doi: 10.1371/journal.pone.0057206. Epub 2013 Feb 19. PLoS One. 2013. PMID: 23431406 Free PMC article. - Must Peutz-Jeghers syndrome patients have the LKB1/STK11 gene mutation? A case report and review of the literature.
Duan FX, Gu GL, Yang HR, Yu PF, Zhang Z. Duan FX, et al. World J Clin Cases. 2018 Aug 16;6(8):224-232. doi: 10.12998/wjcc.v6.i8.224. World J Clin Cases. 2018. PMID: 30148152 Free PMC article. - Deciphering the Role of p60AmotL2 in Epithelial Extrusion and Cell Detachment.
Cui W, Subramani A, Fonseca P, Zhang Y, Tong L, Zhang Y, Egevad L, Lundqvist A, Holmgren L. Cui W, et al. Cells. 2023 Aug 28;12(17):2158. doi: 10.3390/cells12172158. Cells. 2023. PMID: 37681890 Free PMC article. - Outgrowth of single oncogene-expressing cells from suppressive epithelial environments.
Leung CT, Brugge JS. Leung CT, et al. Nature. 2012 Feb 8;482(7385):410-3. doi: 10.1038/nature10826. Nature. 2012. PMID: 22318515 Free PMC article. - New emerging roles for epithelial cell extrusion.
Gu Y, Rosenblatt J. Gu Y, et al. Curr Opin Cell Biol. 2012 Dec;24(6):865-70. doi: 10.1016/j.ceb.2012.09.003. Epub 2012 Oct 5. Curr Opin Cell Biol. 2012. PMID: 23044222 Free PMC article. Review.
References
- Aoki K, Taketo MM. Adenomatous polyposis coli (APC): a multi-functional tumor suppressor gene. J Cell Sci. 2007;120:3327–3336. - PubMed
- Bienz M, Clevers H. Linking colorectal cancer to Wnt signaling. Cell. 2000;103:311–320. - PubMed
- Cozens AL, Yezzi MJ, Kunzelmann K, Ohrui T, Chin L, Eng K, Finkbeiner WE, Widdicombe JH, Gruenert DC. CFTR expression and chloride secretion in polarized immortal human bronchial epithelial cells. Am J Respir Cell Mol Biol. 1994;10:38–47. - PubMed
Publication types
MeSH terms
Substances
Grants and funding
- A11243/CRUK_/Cancer Research UK/United Kingdom
- DP2 OD002056/OD/NIH HHS/United States
- 11243/CRUK_/Cancer Research UK/United Kingdom
- DP2 OD002056-01/OD/NIH HHS/United States
- P30 CA042014/CA/NCI NIH HHS/United States
LinkOut - more resources
Full Text Sources
Molecular Biology Databases
Miscellaneous


