Transcriptomic analysis of host immune and cell death responses associated with the influenza A virus PB1-F2 protein - PubMed (original) (raw)
Transcriptomic analysis of host immune and cell death responses associated with the influenza A virus PB1-F2 protein
Ronan Le Goffic et al. PLoS Pathog. 2011 Aug.
Abstract
Airway inflammation plays a major role in the pathogenesis of influenza viruses and can lead to a fatal outcome. One of the challenging objectives in the field of influenza research is the identification of the molecular bases associated to the immunopathological disorders developed during infection. While its precise function in the virus cycle is still unclear, the viral protein PB1-F2 is proposed to exert a deleterious activity within the infected host. Using an engineered recombinant virus unable to express PB1-F2 and its wild-type homolog, we analyzed and compared the pathogenicity and host response developed by the two viruses in a mouse model. We confirmed that the deletion of PB1-F2 renders the virus less virulent. The global transcriptomic analyses of the infected lungs revealed a potent impact of PB1-F2 on the response developed by the host. Thus, after two days post-infection, PB1-F2 invalidation severely decreased the number of genes activated by the host. PB1-F2 expression induced an increase in the number and level of expression of activated genes linked to cell death, inflammatory response and neutrophil chemotaxis. When generating interactive gene networks specific to PB1-F2, we identified IFN-γ as a central regulator of PB1-F2-regulated genes. The enhanced cell death of airway-recruited leukocytes was evidenced using an apoptosis assay, confirming the pro-apoptotic properties of PB1-F2. Using a NF-kB luciferase adenoviral vector, we were able to quantify in vivo the implication of NF-kB in the inflammation mediated by the influenza virus infection; we found that PB1-F2 expression intensifies the NF-kB activity. Finally, we quantified the neutrophil recruitment within the airways, and showed that this type of leukocyte is more abundant during the infection of the wild-type virus. Collectively, these data demonstrate that PB1-F2 strongly influences the early host response during IAV infection and provides new insights into the mechanisms by which PB1-F2 mediates virulence.
Conflict of interest statement
The authors have declared that no competing interests exist.
Figures
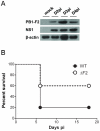
Figure 1. Expression of PB1-F2 and associated pathogenicity in infected mice.
(A) In vivo kinetics of PB1-F2 expression in IAV-infected mice lungs. C57Bl/6 mice were infected with 1.5×10⁵ PFU of IAV strain A/WSN/33. Lungs were collected at different time points pi and lysates were subjected to Western blot using antisera against PB1-F2 and NS1. β-actin was used as a loading control. (B) Lethality induced by wt and ΔF2 IAV in C57Bl/6 mice. Mice received intranasally 2.5×10⁵ PFU of wt or ΔF2 IAV and were observed daily for signs of morbidity.
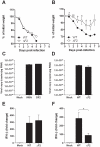
Figure 2. Effect of PB1-F2 expression on pathogenicity during IAV infection.
(A-B) Time-course of body weight changes, mice were inoculated with 1×10⁶ PFU (A) and 5×10⁴ PFU (B) and their weights measured every day. (C-D) Viral load in lungs of mice challenged by 1×10⁶ PFU (C) and 5×10⁴ PFU (D) of wt and ΔF2 IAV. Results are the mean ± SD values obtained from 4 animals at day 3 pi. They are expressed as RNA copies normalized to the quantity of RNA used in the experiment. (E–F) Real time RT-PCR quantification of IFN-β gene expression in lungs of mice infected by 1×10⁶ PFU (E) and 5×10⁴ PFU (F) of wt and ΔF2 IAV 3 days pi. IFN-β expression was normalized with the β-actin gene expression level and presented as fold increase relative to mock-treated mice. (* p<0.05; **p<0.01).
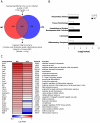
Figure 3. Microarray analysis of gene expression in the lungs of mice on day 2 pi.
(A) Venn diagram showing the distribution of differentially regulated genes during infection with wt or ΔF2 IAV relative to mock-infected mice. (B) Functional categories comparison of differentially expressed genes in lungs of mice infected with wt or ΔF2 IAV. (C) Heat map of selected genes related to innate defense in the lungs of wt- and ΔF2-infected mice at day 2 pi based on analysis using Genespring software (Agilent). Genes shown in red are up-regulated and those shown in blue are down-regulated in infected mice compared to mock-infected mice. Data are expressed in Log base 2 ratio.
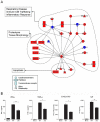
Figure 4. Gene network analysis.
(A) Biological network of genes that were specifically regulated more than 2 fold (P<0.05) in the wt-infected mice lungs compared with mock-infected controls. Lines between nodes in the network represent gene interactions. Subset of genes that were regulated during wt IAV infection but not during ΔF2 IAV infection are shown in red, and genes expressed at a high level in the two infectious conditions are shown in blue. Biological networks were made by using Ingenuity Pathway Analysis. The meaning of the symbols is indicated in the inset of the figure. (B) BAL fluids levels of IFN-γ, TNF-α, CXCL1/KC and IL-6 in mock-infected, wt-infected and ΔF2-infected mice at day 2 (IFN-γ) or day 3 (TNF-α, CXCL1/KC and IL-6) pi (*p<0.05, **p<0.01).
Figure 5. Apoptotic index of leukocytes present in the BAL fluids of IAV-infected mice.
(A) Cells from BAL fluids of IAV-infected mice were harvested after 3 days pi. Apoptotic index was assayed by measuring the ADP:ATP ratio (*p<0.05). (B) Ingenuity Systems software was used to represent regulation of genes involved in apoptotic pathway during wt IAV infection of mice lungs. Genes depicted in red are increased and genes in green are decreased compared with mock-infected mice. Color intensity increases with the magnitude of fold-change.
Figure 6. NF-κB luminescence in the lungs of wt and ΔF2 IAV-infected mice.
(A) Groups of 4 Balb/c mice were co-infected at day 0 by either wt or ΔF2 IAV (1.5×10⁵ PFU per mouse) and by a replication-deficient adenovirus used to transduce NF-κB-luciferase construct (Ad-NF-κB-luc). Bioluminescence was then measured daily by intranasal injection of 50 µl of luciferine (500 µg/ml) and capture of photon emission from the chest at different times post-infection using the IVIS system. (B) Pictures of anesthetized mice after luciferine instillation taken 3 days pi. The scale on the right indicates the average radiance: the sum of the photons per second from each pixel inside the ROI/number of pixels (photons/sec/cm2/sr).
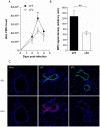
Figure 7. PB1-F2 promotes neutrophil recruitment within IAV-infected mice lungs.
(A) Groups of three mice were infected by the wt or the ΔF2 viruses and assayed for number of neutrophils in the BAL fluids after 0, 2, 3 and 4 days pi. (B) In situ immunohistochemistry labeling of the neutrophil marker MPO was assayed on wt-infected and ΔF2-infected 3 days pi. MPO signal density was quantified using “Image J” software. (C) Representative sections of mock-infected (left panels), wt-infected (middle panels) and ΔF2-infected (right panels) mice lungs labeled for NS1 and MPO.
Similar articles
- Evolution and Virulence of Influenza A Virus Protein PB1-F2.
Kamal RP, Alymova IV, York IA. Kamal RP, et al. Int J Mol Sci. 2017 Dec 29;19(1):96. doi: 10.3390/ijms19010096. Int J Mol Sci. 2017. PMID: 29286299 Free PMC article. Review. - Kinetic characterization of PB1-F2-mediated immunopathology during highly pathogenic avian H5N1 influenza virus infection.
Leymarie O, Jouvion G, Hervé PL, Chevalier C, Lorin V, Lecardonnel J, Da Costa B, Delmas B, Escriou N, Le Goffic R. Leymarie O, et al. PLoS One. 2013;8(3):e57894. doi: 10.1371/journal.pone.0057894. Epub 2013 Mar 1. PLoS One. 2013. PMID: 23469251 Free PMC article. - Effects of PB1-F2 on the pathogenicity of H1N1 swine influenza virus in mice and pigs.
Lee J, Henningson J, Ma J, Duff M, Lang Y, Li Y, Li Y, Nagy A, Sunwoo S, Bawa B, Yang J, Bai D, Richt JA, Ma W. Lee J, et al. J Gen Virol. 2017 Jan;98(1):31-42. doi: 10.1099/jgv.0.000695. J Gen Virol. 2017. PMID: 28008819 Free PMC article. - The Influenza Virus Protein PB1-F2 Increases Viral Pathogenesis through Neutrophil Recruitment and NK Cells Inhibition.
Vidy A, Maisonnasse P, Da Costa B, Delmas B, Chevalier C, Le Goffic R. Vidy A, et al. PLoS One. 2016 Oct 31;11(10):e0165361. doi: 10.1371/journal.pone.0165361. eCollection 2016. PLoS One. 2016. PMID: 27798704 Free PMC article. - Current knowledge on PB1-F2 of influenza A viruses.
Krumbholz A, Philipps A, Oehring H, Schwarzer K, Eitner A, Wutzler P, Zell R. Krumbholz A, et al. Med Microbiol Immunol. 2011 May;200(2):69-75. doi: 10.1007/s00430-010-0176-8. Epub 2010 Oct 16. Med Microbiol Immunol. 2011. PMID: 20953627 Review.
Cited by
- Viral PB1-F2 and host IFN-γ guide ILC2 and T cell activity during influenza virus infection.
Barman TK, Huber VC, Bonin JL, Califano D, Salmon SL, McKenzie ANJ, Metzger DW. Barman TK, et al. Proc Natl Acad Sci U S A. 2022 Feb 22;119(8):e2118535119. doi: 10.1073/pnas.2118535119. Proc Natl Acad Sci U S A. 2022. PMID: 35169077 Free PMC article. - Amyloid Assemblies of Influenza A Virus PB1-F2 Protein Damage Membrane and Induce Cytotoxicity.
Vidic J, Richard CA, Péchoux C, Da Costa B, Bertho N, Mazerat S, Delmas B, Chevalier C. Vidic J, et al. J Biol Chem. 2016 Jan 8;291(2):739-51. doi: 10.1074/jbc.M115.652917. Epub 2015 Nov 24. J Biol Chem. 2016. PMID: 26601953 Free PMC article. - Development of next-generation respiratory virus vaccines through targeted modifications to viral immunomodulatory genes.
Stobart CC, Moore ML. Stobart CC, et al. Expert Rev Vaccines. 2015;14(12):1563-72. doi: 10.1586/14760584.2015.1095096. Epub 2015 Oct 5. Expert Rev Vaccines. 2015. PMID: 26434947 Free PMC article. Review. - Evolution and Virulence of Influenza A Virus Protein PB1-F2.
Kamal RP, Alymova IV, York IA. Kamal RP, et al. Int J Mol Sci. 2017 Dec 29;19(1):96. doi: 10.3390/ijms19010096. Int J Mol Sci. 2017. PMID: 29286299 Free PMC article. Review. - Effects of the PA-X and PB1-F2 Proteins on the Virulence of the 2009 Pandemic H1N1 Influenza A Virus in Mice.
Ma J, Li S, Li K, Wang X, Li S. Ma J, et al. Front Cell Infect Microbiol. 2019 Sep 3;9:315. doi: 10.3389/fcimb.2019.00315. eCollection 2019. Front Cell Infect Microbiol. 2019. PMID: 31552197 Free PMC article.
References
- Chen W, Calvo PA, Malide D, Gibbs J, Schubert U, et al. A novel influenza A virus mitochondrial protein that induces cell death. Nat Med. 2001;7:1306–1312. - PubMed
Publication types
MeSH terms
Substances
LinkOut - more resources
Full Text Sources
Miscellaneous
