Modulation of Mucosal Immune Response, Tolerance, and Proliferation in Mice Colonized by the Mucin-Degrader Akkermansia muciniphila - PubMed (original) (raw)
Modulation of Mucosal Immune Response, Tolerance, and Proliferation in Mice Colonized by the Mucin-Degrader Akkermansia muciniphila
Muriel Derrien et al. Front Microbiol. 2011.
Abstract
Epithelial cells of the mammalian intestine are covered with a mucus layer that prevents direct contact with intestinal microbes but also constitutes a substrate for mucus-degrading bacteria. To study the effect of mucus degradation on the host response, germ-free mice were colonized with Akkermansia muciniphila. This anaerobic bacterium belonging to the Verrucomicrobia is specialized in the degradation of mucin, the glycoprotein present in mucus, and found in high numbers in the intestinal tract of human and other mammalian species. Efficient colonization of A. muciniphila was observed with highest numbers in the cecum, where most mucin is produced. In contrast, following colonization by Lactobacillus plantarum, a facultative anaerobe belonging to the Firmicutes that ferments carbohydrates, similar cell-numbers were found at all intestinal sites. Whereas A. muciniphila was located closely associated with the intestinal cells, L. plantarum was exclusively found in the lumen. The global transcriptional host response was determined in intestinal biopsies and revealed a consistent, site-specific, and unique modulation of about 750 genes in mice colonized by A. muciniphila and over 1500 genes after colonization by L. plantarum. Pathway reconstructions showed that colonization by A. muciniphila altered mucosal gene expression profiles toward increased expression of genes involved in immune responses and cell fate determination, while colonization by L. plantarum led to up-regulation of lipid metabolism. These indicate that the colonizers induce host responses that are specific per intestinal location. In conclusion, we propose that A. muciniphila modulates pathways involved in establishing homeostasis for basal metabolism and immune tolerance toward commensal microbiota.
Keywords: Akkermansia muciniphila; germ-free mice colonization; host responses; mucin.
Figures
Figure 1
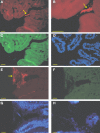
Micrograph of intestinal biopsy samples from mono-colonized mice. (A–D) Ileal biopsies and colonic (E–G) of mice mono-associated with A. muciniphila. Cells were hybridized with the Cy3-labeled MUC-1437, specifically staining A. muciniphila. (A,B,E), aggregates of A. muciniphila cells are zoomed and closely associated with the epithelial cells (B), FITC-labeled EUB-338, targeting all bacteria (C,F) and a DAPI staining (D,G). Arrows indicate aggregates of A. muciniphila. (H) Cecal biopsy from L. plantarum mono-associated mouse stained with DAPI. Bar represents 10 μm.
Figure 2
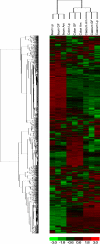
Hierarchical clustering of genes obtained using D-Chip software. Hierarchical clustering was performed on intensity values generated by Affymetrix MAS 5.0 software, showing differential responses in the three locations (ileum, cecum, and colon) and with bacteria [A. muciniphila (Am) and L. plantarum (Lp) compared to germ-free (GF) mice]. Each column corresponds to one array (pool of six RNA) and each frame corresponds to one probe set. Red corresponds to an up-regulation of the gene expression and green to a down-regulation. Black corresponds to no change.
Figure 3
Number of significantly up- (red) and down- (green) regulated genes in the ileum, cecum, and colon of mice mono-associated with A. muciniphila and L. plantarum vs. germ-free mice. Gray represents common regulated genes.
Figure 4
Venn diagrams representing the number of common significantly regulated genes in the ileum (white), cecum (light gray), and colon (dark gray) of mice mono-associated with A. muciniphila (A) and L. plantarum (B) interaction compared to germ-free mice data and L. plantarum compared to A. muciniphila data (C).
Figure 5
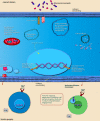
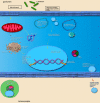
Main cellular pathways and processes inferred to be modulated or activated after colonization of mouse cecum by A. muciniphila. Only induced pathways are shown. Distinguishing features are the induction of pathways involved in (epithelial) cell membrane modifications, sulfur metabolism, and pathways involved in the maturation of immune cells via induction of surface receptors. Pathways were considered to be induced if (nearly) all of the genes belonging to the pathway were up-regulated. The upper part of the image shows pathways and processes that are expected to occur in epithelial cells as well as pathways and processes with undefined or non-specific localization. Pathways and processes named in text “balloons” were among the most significantly modulated pathways according to IPA canonical pathway analysis. The lower part of the image shows pathways known to be regulated in immune cells of the lamina propria. In order to determine in which cell type and subcellular compartment a gene product was localized, the Entrez Gene GO annotation, Entrez Gene GeneRIFs, and scientific literature information were used. Interacting pathways and processes are grouped together as well as possible, both in terms of annotation as well as within the graphical space limitations.
Figure 6
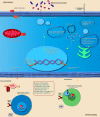
Main cellular pathways and processes inferred to be modulated or activated after colonization of mouse colon by A. muciniphila. Distinguishing features are the induction of pathways involved in intracellular signaling, induction of secretion of (antimicrobial) factors, and of pathways that promote expression of immune cell receptors that mediate adhesion and T or B cell receptor signaling. For further explanation, see legend of Figure 5.
Figure 7
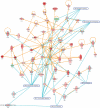
Network representation of altered cellular functions during colonization of the mouse colon by A. muciniphila for the gene ontology (GO) category “immune response.” The network shows that most of the genes regulating the immune response are up-regulated during colonization. Central regulatory genes encode growth factors (e.g., Igf1), cell surface molecules (Cd19, Cd37), (receptor) phosphatases (Ptprc or Cd45), and protein kinases (Lck, Fyn) that regulate (immune) cell proliferation and differentiation. The protein interaction network was derived from the transcription data using ingenuity pathway analysis (IPA). Nodes indicate proteins, the yellow lines connecting them represent interactions (e.g., protein–protein binding or phosphorylation events) that are mapped by Ingenuity’s knowledge base (see Materials and Methods). Colors indicate altered transcription of the encoding genes, with deeper shades of red indicating stronger up-regulation, and deeper shades of green indicating stronger down-regulation. The genes and their encoded proteins that are used to reconstruct specific networks were selected based on overrepresentation of GO categories (“cellular functions” in IPA) and involvement in significantly (see Materials and Methods) modulated canonical pathways. The overlays with blue radiating lines represent some of these canonical pathways (CP) and are useful to indicate in which cellular pathways differentially regulated genes and their interacting products participate for the given GO categories. Note that in this network exemplifying the genetic regulation of the mouse colonic immune response to A. muciniphila, most of the genes are up-regulated, indicating that the immune response was induced following colonization of these bacteria.
Figure 8
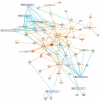
Network representation of altered cellular functions during colonization of the mouse ileum by L. plantarum for the category “lipid metabolism.” The network shows that most of the genes that are co-expressed with the major regulators, PPAR and RXR are up-regulated, or up-regulated through the activity of the sterol regulatory element binding transcription factor 2 (Srebf2).
Figure 9
Main cellular pathways and processes inferred to be modulated or activated after colonization of mouse ileum by L. plantarum. Distinguishing features are the up-regulation of relatively high numbers of genes encoding factors involved in lipid metabolism and of genes encoding transcription factors that regulate intestinal absorptive functions and the immune response.
Similar articles
- Recent findings in Akkermansia muciniphila-regulated metabolism and its role in intestinal diseases.
Liu MJ, Yang JY, Yan ZH, Hu S, Li JQ, Xu ZX, Jian YP. Liu MJ, et al. Clin Nutr. 2022 Oct;41(10):2333-2344. doi: 10.1016/j.clnu.2022.08.029. Epub 2022 Sep 3. Clin Nutr. 2022. PMID: 36113229 Review. - Genome-Scale Model and Omics Analysis of Metabolic Capacities of Akkermansia muciniphila Reveal a Preferential Mucin-Degrading Lifestyle.
Ottman N, Davids M, Suarez-Diez M, Boeren S, Schaap PJ, Martins Dos Santos VAP, Smidt H, Belzer C, de Vos WM. Ottman N, et al. Appl Environ Microbiol. 2017 Aug 31;83(18):e01014-17. doi: 10.1128/AEM.01014-17. Print 2017 Sep 15. Appl Environ Microbiol. 2017. PMID: 28687644 Free PMC article. - Akkermansia muciniphila in the Human Gastrointestinal Tract: When, Where, and How?
Geerlings SY, Kostopoulos I, de Vos WM, Belzer C. Geerlings SY, et al. Microorganisms. 2018 Jul 23;6(3):75. doi: 10.3390/microorganisms6030075. Microorganisms. 2018. PMID: 30041463 Free PMC article. Review. - Mucin degrader Akkermansia muciniphila accelerates intestinal stem cell-mediated epithelial development.
Kim S, Shin YC, Kim TY, Kim Y, Lee YS, Lee SH, Kim MN, O E, Kim KS, Kweon MN. Kim S, et al. Gut Microbes. 2021 Jan-Dec;13(1):1-20. doi: 10.1080/19490976.2021.1892441. Gut Microbes. 2021. PMID: 33678130 Free PMC article. - Commensal Akkermansia muciniphila exacerbates gut inflammation in Salmonella Typhimurium-infected gnotobiotic mice.
Ganesh BP, Klopfleisch R, Loh G, Blaut M. Ganesh BP, et al. PLoS One. 2013 Sep 10;8(9):e74963. doi: 10.1371/journal.pone.0074963. eCollection 2013. PLoS One. 2013. PMID: 24040367 Free PMC article.
Cited by
- The PPARα Regulation of the Gut Physiology in Regard to Interaction with Microbiota, Intestinal Immunity, Metabolism, and Permeability.
Grabacka M, Płonka PM, Pierzchalska M. Grabacka M, et al. Int J Mol Sci. 2022 Nov 16;23(22):14156. doi: 10.3390/ijms232214156. Int J Mol Sci. 2022. PMID: 36430628 Free PMC article. Review. - Postoperative Complications Are Associated with Long-Term Changes in the Gut Microbiota Following Colorectal Cancer Surgery.
Schmitt FCF, Schneider M, Mathejczyk W, Weigand MA, Figueiredo JC, Li CI, Shibata D, Siegel EM, Toriola AT, Ulrich CM, Ulrich AB, Boutin S, Gigic B. Schmitt FCF, et al. Life (Basel). 2021 Mar 16;11(3):246. doi: 10.3390/life11030246. Life (Basel). 2021. PMID: 33809741 Free PMC article. - Characterization of Outer Membrane Proteome of Akkermansia muciniphila Reveals Sets of Novel Proteins Exposed to the Human Intestine.
Ottman N, Huuskonen L, Reunanen J, Boeren S, Klievink J, Smidt H, Belzer C, de Vos WM. Ottman N, et al. Front Microbiol. 2016 Jul 26;7:1157. doi: 10.3389/fmicb.2016.01157. eCollection 2016. Front Microbiol. 2016. PMID: 27507967 Free PMC article. - Administration of Akkermansia muciniphila Ameliorates Dextran Sulfate Sodium-Induced Ulcerative Colitis in Mice.
Bian X, Wu W, Yang L, Lv L, Wang Q, Li Y, Ye J, Fang D, Wu J, Jiang X, Shi D, Li L. Bian X, et al. Front Microbiol. 2019 Oct 1;10:2259. doi: 10.3389/fmicb.2019.02259. eCollection 2019. Front Microbiol. 2019. PMID: 31632373 Free PMC article. - Characterization of the Functional Changes in Mouse Gut Microbiome Associated with Increased Akkermansia muciniphila Population Modulated by Dietary Black Raspberries.
Tu P, Bian X, Chi L, Gao B, Ru H, Knobloch TJ, Weghorst CM, Lu K. Tu P, et al. ACS Omega. 2018 Sep 30;3(9):10927-10937. doi: 10.1021/acsomega.8b00064. Epub 2018 Sep 10. ACS Omega. 2018. PMID: 30288460 Free PMC article.
References
- Baken K., Ezendam J., Gremmer E., de Klerk A., Pennings J., Matthee B., Peijnenburg A., van Loveren H. (2006). Evaluation of immunomodulation by Lactobacillus casei Shirota: immune function, autoimmunity and gene expression. Int. J. Food Microbiol. 112, 8–1810.1016/j.ijfoodmicro.2006.06.009 - DOI - PubMed
- Cardona M., Midtvedt T., Norin E. (2001). Probiotics in gnotobiotic mice: short chain fatty acid production in vitro and in vivo. Scand. J. Lab. Anim. Sci. 28, 75–84
LinkOut - more resources
Full Text Sources
Other Literature Sources
