Exploiting cancer cell vulnerabilities to develop a combination therapy for ras-driven tumors - PubMed (original) (raw)
. 2011 Sep 13;20(3):400-13.
doi: 10.1016/j.ccr.2011.08.014.
Zandra Walton, Jessica L Yecies, Danan Li, Yimei Chen, Clare F Malone, Ophélia Maertens, Seung Min Jeong, Roderick T Bronson, Valerie Lebleu, Raghu Kalluri, Emmanuel Normant, Marcia C Haigis, Brendan D Manning, Kwok-Kin Wong, Kay F Macleod, Karen Cichowski
Affiliations
- PMID: 21907929
- PMCID: PMC3233475
- DOI: 10.1016/j.ccr.2011.08.014
Exploiting cancer cell vulnerabilities to develop a combination therapy for ras-driven tumors
Thomas De Raedt et al. Cancer Cell. 2011.
Abstract
Ras-driven tumors are often refractory to conventional therapies. Here we identify a promising targeted therapeutic strategy for two Ras-driven cancers: Nf1-deficient malignancies and Kras/p53 mutant lung cancer. We show that agents that enhance proteotoxic stress, including the HSP90 inhibitor IPI-504, induce tumor regression in aggressive mouse models, but only when combined with rapamycin. These agents synergize by promoting irresolvable ER stress, resulting in catastrophic ER and mitochondrial damage. This process is fueled by oxidative stress, which is caused by IPI-504-dependent production of reactive oxygen species, and the rapamycin-dependent suppression of glutathione, an important endogenous antioxidant. Notably, the mechanism by which these agents cooperate reveals a therapeutic paradigm that can be expanded to develop additional combinations.
Copyright © 2011 Elsevier Inc. All rights reserved.
Figures
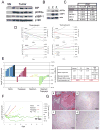
Figure 1. Therapeutic effects of rapamycin and ER stress inducing agents on MPNSTs
(A) Immunoblots of tumor tissue derived from Nf1/p53 mutant murine MPNSTs and normal peripheral nerve (NN). BIP, phospho-EIF2a (pEIF2α) and the spliced form of XBP-1 (sXBP-1) indicate UPR activation. (B) Immunoblots of pEIF2α and sXBP-1 in MPNST cells after 4 hours of 100nM thapsigargin (TG) or 0.5ug/ml tunicamycin (TN). Actin is a loading control. (C) LD50 values in response to TG or TN (48 hours) in normal cells (IMR90), human MPNST cell lines (S462, SNF96.2) and mouse MPNST cell lines (185-3, 1A50). (D) Growth curves comparing the effects of different doses of thapsigargin and tunicamycin in S462 human MPNSTs and IMR90s. (E) Waterfall plot depicting tumor growth after 10 days of treatment with vehicle (blue), thapsigargin (red), rapamycin (yellow) and rapamycin/thapsigargin (green). The left y-axis indicates the log2 of tumor fold growth vs. day 0 and the right y-axis shows the change in fold volume. The table shown reports mean and standard deviation for each treatment arm (n=8) and mean tumor shrinkage. (F) Graph depicting the change in tumor size over time. Three animals on the rapamycin/thapsigargin combination are shown (green). For simplicity the yellow line is an average volume of rapamycin treated tumors (n=8). Blue and red lines represent vehicle and thapsigargin treated animals respectively. (G) H&E stained tumor remnants from animals treated with rapamycin/thapsigargin. Sections from tumors after (a) 107 days of treatment, (b) 35 days (c), 21 days (d) 4 days, showing pyknotic nuclei throughout the tumor. All images were taken using 10× objective, except (d) which has been magnified to 40×. (See also Figure S1)
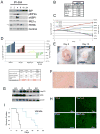
Figure 2. Rapamycin and IPI-504 promote MPNST regression
(A) Immunoblots of BIP, pEIF2α, sXBP-1, IRE1α and PERK in human MPNSTs treated with IPI-504 over time (hours). Note that the activation of pEIF2α, sXBP1, IRE1 and PERK (*denotes activated phosphorylated PERK) and initial upregualtion of BIP occurs within 2-4 hours. A second wave of BIP upregulation occurs between 8-16 hours, as pEIF2α, sXBP-1, IRE1α and PERK become suppressed. Actin serves as a loading control. (B) LD50 values in response to IPI-504 (72 hours) for normal cells (IMR90), human MPNST cell lines (S462, SNF96.2) and mouse MPNST cell lines (185-3, 1A50). (C) Growth curves of the S462 cell line treated with different concentrations of IPI-504. (D) Waterfall plot depicting tumor growth after 10 days of treatment with vehicle (blue), IPI-504 (red), rapamycin (yellow) and rapamycin/IPI-504(green). The left y-axis indicates the log2 of tumor fold growth vs. day 0 and the right y-axis shows the change in fold volume. The table reports mean and standard deviation for each treatment arm (n=8) and mean tumor shrinkage. The Shapiro-Wilk test shows that all data sets have a normal distribution. (E) A photograph of an MPNST is shown at day 0 and after 10 days of treatment with Rapamycin/IPI-504. (F) H&E stained tumors from animals treated with rapamycin/IPI-504. (G) Pharmacodynamic analysis of lung tissue after 16h of treatment as shown by an Hsp70 and phosphoS6 immunoblots. p120 serves as a loading control. (H) TUNEL staining of tumors treated for 16h. (I) Kaplain-Meier curve of tumor bearing Nf1/p53 mutant mice treated with vehicle (black) or rapamycin (blue) as described. X's indicate and animal that was euthanized due to skin ulceration. All error bars show +/− SD. (See also Figure S2)
Figure 3. Cell death induced by IPI-504 is due to inhibition of HSP90 and subsequent effects on the UPR and ER stress
(A) Growth curves of the MPNST cell line S462 treated with two different HSP90 inhibitors (500nM IPI-504 and 500nM BEP800). (B) S462 cells were treated with the HSP90 inhibitor AUY-922 (100nM), for 72 hours. The left y-axis indicates the log2 of tumor fold change vs. day 0 and the right y-axis shows the relative change in cell number as compared to day 0. (C) Immunoblots showing the effects of AUY-922 on BIP, pEIF2α, sXBP-1, IRE1α and PERK in human MPNST cells over time (hours). Actin serves as a loading control. (D) Relative level of cell death in the presence of 1μM IPI-504 with and without over-expression of sXBP1 (the activated spliced form of XBP1). The right hand panel confirms expression of sXBP1. (E) Growth curves in response to low doses of IPI-504 in cells where IRE1α and/or PERK are knocked down by siRNA. The immunoblot confirms knock down. (F) S462 cells were treated with 100nM IPI-504 for 72 hours, with and without rapamycin pretreatment (100nM) (left) or Raptor shRNA (right). The left y-axis indicates the log2 of tumor fold change vs. day 0 and the right y-axis shows the relative change in cell number as compared to day 0. (G) Relative number of S462 cells after combined knock down of IRE1α and PERK with or without rapamycin (100nM) as compared to rapamycin plus IPI-504 (300nM). (F) pAKT/AKT mmunoblots of tumor tissue from animals treated for 16 hours in mice exposed to vehicle (Veh), IPI-504 (IP), rapamycin (R) and rapamycin/IPI-504 (RIP). All error bars show +/− SD. (See also Figure S3)
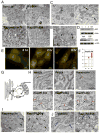
Figure 4. IPI-504 and rapamycin trigger a catastrophic destruction of the ER and mitochondria in MPNSTs
(A) Transmission Electron Microscopy (TEM) images (5,900×1.4×) of tumors after 7h of treatment with vehicle, IPI-504, rapamycin or rapamycin/IPI-504. (B) TEM images (15000×1.4×) of tumors treated for 7 hours with rapamcyin/IPI-504. Black arrows indicate double-membraned autophagosomes with cargo. (C) TEM images of a tumor treated for 7 hours with rapamycin/IPI-504. The black arrows show autophagosomes emanating from a mitochondrion (left panel) and ER (right panel). (D) (Top) Immunoblot for p62 (SQSTM1) from MPNST tissue in animals treated with vehicle (V), IPI-504 (I), rapmycin (R) or rapamycin and IPI-504 (RIP). (Bottom) A second immunoblot demonstrating a decrease in p62 levels in additional RIP treated tumors. (E) S462 cells were infected with mCherry-EGFP-LC3B and treated for 2 and 8 hours with 100nM Rapamycin and 4μM IPI-504. Yellow/green spots punctae represent autophagosomes. Red spots represent autophagolysosomes. (F) Bargraph representing the average number of autophagosomes (yellow bar) and autophagolysosomes (red bar) after 0, 2 and 8 hours of treatment of rapamycin and IPI-504. (G) Model illustrating cross-talk between ER stress, mitochondria and ROS production. (H) TEM depicting the relative size of the ER in tumors exposed to vehicle, IPI-504, rapamycin or rapamycin/IPI-504. (I) TEM showing numerous ER membranes in rapamycin treated tumors (blue dots) in contrast to tumors exposed to rapamycin/IPI-504 for 16 hours, where they are not visible. Black arrows show a few autophagosomes in rapamycin treated tumors and many in rapamycin/IPI-504 treated tumors. (J) TEM showing normal mitochondria in vehicle treated tumors (blue arrows, left) versus swollen vesicularized mitochondria in tumors treated with rapamyin/IPI-504 for 16 hours (blue arrows, right). The mitochondria on the left in this panel is being engulfed by an autophagosome. (See also Figure S4)
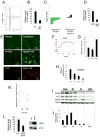
Figure 5. Oxidative stress plays a critical role in mediating the therapeutic response to IPI-504 and rapamycin
(A) Levels of ROS induced by IPI-504 in MPNST cell lines in vitro. The red line depicts the shift in fluorescence intensity, reflecting ROS production. (B) Relative levels of cell death in the presence of 500nM IPI-504 +/− 100uM Vitamin C. (C) Waterfall plot depicting tumor growth after 10 days of treatment with rapamycin/IPI-504 as shown in Figure 2 (green) versus rapamycin/IPI-504 and Vitamin C (black). The left y-axis indicates the log2 of tumor fold growth vs. day 0. (D) Relative levels of cell death in response to 500nM BEP800 +/− 100uM Vitamin C. (E) (Top 4 panels) Immunocytochemistry using a PML antibody (green) on tumors treated for 7 hours as indicated. (Bottom 2 panels) Dihydroethidium staining (red) of frozen MPNST tumor tissue depicting an increase in ROS levels in response to Rap/IPI-504 after 7 hours of treatment. (F) Kinetics of ROS induction in S462 cells in response to IPI-504/Rap. (G) Kinetics of the ratio of ADP/ATP in S462 cells in response to IPI-504/Rap. Note that ROS production precedes the increase in ADP/ATP levels (decrease in ATP). (H) SREBP1 mRNA levels in tumors from animals that were treated for 7 hours as indicated. (I) Immunoblots showing expression of FASN, ACC and G6PD in tumors from animals treated for 7h as indicated. Actin serves as a loading control. (J) G6PD mRNA levels in individual tumors treated as described in i. (K) Relative levels of reduced glutathione (GSH) in tumors treated with vehicle or rapamycin/IPI-504 (n-6). (L) Relative levels of cell death caused by IPI-504 in cells ectopically expressing G6PD or a GFP control plasmid. Immunblot demonstrating G6PD protein levels in MPNSTs used in the left panel. (See also Figure S5)
Figure 6. Rapamcyin/IPI-504 promotes regression of _KrasG12D, p53_-deficient NSCLC
(A) MRI images of animals pre and post treatment as specified. The red circles highlight tumor masses. (B) Table listing the volumetric change of individual tumor masses as determined by MRI. (C) Waterfall plot depicting the reduction of total tumor volume in individual animals treated with rapamycin and IPI-504. (D) H&E stain of histological sections of the lung after 14 days of treatment (2×). (E) H&E stain of lesions from animals treated with vehicle, rapamycin, IPI-504 or rapamyin/IPI-504 for 2 weeks. Images b, d and f are enlargements of images a, c and e respectively. (See also Figure S6)
Comment in
- Ras, ROS and proteotoxic stress: a delicate balance.
Xu W, Trepel J, Neckers L. Xu W, et al. Cancer Cell. 2011 Sep 13;20(3):281-2. doi: 10.1016/j.ccr.2011.08.020. Cancer Cell. 2011. PMID: 21907917 Free PMC article.
Similar articles
- Suppression of heat shock protein 27 using OGX-427 induces endoplasmic reticulum stress and potentiates heat shock protein 90 inhibitors to delay castrate-resistant prostate cancer.
Lamoureux F, Thomas C, Yin MJ, Fazli L, Zoubeidi A, Gleave ME. Lamoureux F, et al. Eur Urol. 2014 Jul;66(1):145-55. doi: 10.1016/j.eururo.2013.12.019. Epub 2013 Dec 29. Eur Urol. 2014. PMID: 24411988 Free PMC article. - The Hsp90 inhibitor IPI-504 rapidly lowers EML4-ALK levels and induces tumor regression in ALK-driven NSCLC models.
Normant E, Paez G, West KA, Lim AR, Slocum KL, Tunkey C, McDougall J, Wylie AA, Robison K, Caliri K, Palombella VJ, Fritz CC. Normant E, et al. Oncogene. 2011 Jun 2;30(22):2581-6. doi: 10.1038/onc.2010.625. Epub 2011 Jan 24. Oncogene. 2011. PMID: 21258415 - Combined effect of Hsp90 inhibitor geldanamycin and parthenolide via reactive oxygen species-mediated apoptotic process on epithelial ovarian cancer cells.
Lee CS, Kim YJ, Lee SA, Myung SC, Kim W. Lee CS, et al. Basic Clin Pharmacol Toxicol. 2012 Sep;111(3):173-81. doi: 10.1111/j.1742-7843.2012.00883.x. Epub 2012 Apr 16. Basic Clin Pharmacol Toxicol. 2012. PMID: 22433057 - Targeting KRAS Mutant Non-Small-Cell Lung Cancer: Past, Present and Future.
Uras IZ, Moll HP, Casanova E. Uras IZ, et al. Int J Mol Sci. 2020 Jun 17;21(12):4325. doi: 10.3390/ijms21124325. Int J Mol Sci. 2020. PMID: 32560574 Free PMC article. Review. - Discovery and development of heat shock protein 90 inhibitors as anticancer agents: a review of patented potent geldanamycin derivatives.
Kim T, Keum G, Pae AN. Kim T, et al. Expert Opin Ther Pat. 2013 Aug;23(8):919-43. doi: 10.1517/13543776.2013.780597. Epub 2013 May 4. Expert Opin Ther Pat. 2013. PMID: 23641970 Review.
Cited by
- A global view of Hsp90 functions.
Chiosis G, Dickey CA, Johnson JL. Chiosis G, et al. Nat Struct Mol Biol. 2013 Jan;20(1):1-4. doi: 10.1038/nsmb.2481. Nat Struct Mol Biol. 2013. PMID: 23288357 Free PMC article. - Antagonism between FOXO and MYC Regulates Cellular Powerhouse.
Peck B, Ferber EC, Schulze A. Peck B, et al. Front Oncol. 2013 Apr 25;3:96. doi: 10.3389/fonc.2013.00096. eCollection 2013. Front Oncol. 2013. PMID: 23630664 Free PMC article. - Triolimus: A Multi-Drug Loaded Polymeric Micelle Containing Paclitaxel, 17-AAG, and Rapamycin as a Novel Radiosensitizer.
Tomoda K, Tam YT, Cho H, Buehler D, Kozak KR, Kwon GS. Tomoda K, et al. Macromol Biosci. 2017 Jan;17(1):10.1002/mabi.201600194. doi: 10.1002/mabi.201600194. Epub 2016 Jul 1. Macromol Biosci. 2017. PMID: 27365266 Free PMC article. - The critical roles of endoplasmic reticulum chaperones and unfolded protein response in tumorigenesis and anticancer therapies.
Luo B, Lee AS. Luo B, et al. Oncogene. 2013 Feb 14;32(7):805-18. doi: 10.1038/onc.2012.130. Epub 2012 Apr 16. Oncogene. 2013. PMID: 22508478 Free PMC article. Review. - RHOA-FAK is a required signaling axis for the maintenance of KRAS-driven lung adenocarcinomas.
Konstantinidou G, Ramadori G, Torti F, Kangasniemi K, Ramirez RE, Cai Y, Behrens C, Dellinger MT, Brekken RA, Wistuba II, Heguy A, Teruya-Feldstein J, Scaglioni PP. Konstantinidou G, et al. Cancer Discov. 2013 Apr;3(4):444-57. doi: 10.1158/2159-8290.CD-12-0388. Epub 2013 Jan 28. Cancer Discov. 2013. PMID: 23358651 Free PMC article.
References
- Cawthon RM, Weiss R, Xu GF, Viskochil D, Culver M, Stevens J, Robertson M, Dunn D, Gesteland R, O'Connell P, et al. A major segment of the neurofibromatosis type 1 gene: cDNA sequence, genomic structure, and point mutations. Cell. 1990;62:193–201. - PubMed
- Cichowski K, Shih TS, Schmitt E, Santiago S, Reilly K, McLaughlin ME, Bronson RT, Jacks T. Mouse models of tumor development in neurofibromatosis type 1. Science. 1999;286:2172–2176. - PubMed
Publication types
MeSH terms
Substances
Grants and funding
- CA122794/CA/NCI NIH HHS/United States
- R01 CA129814/CA/NCI NIH HHS/United States
- R01 CA122794/CA/NCI NIH HHS/United States
- R01 CA131188/CA/NCI NIH HHS/United States
- R01 CA140594/CA/NCI NIH HHS/United States
- CA140594/CA/NCI NIH HHS/United States
- R01 CA122617/CA/NCI NIH HHS/United States
- CA129814/CA/NCI NIH HHS/United States
LinkOut - more resources
Full Text Sources
Other Literature Sources
Molecular Biology Databases
Research Materials
Miscellaneous


