Genomic binding of Pol III transcription machinery and relationship with TFIIS transcription factor distribution in mouse embryonic stem cells - PubMed (original) (raw)
doi: 10.1093/nar/gkr737. Epub 2011 Sep 12.
Sébastien Graziani, Olivier Alibert, Yad Ghavi-Helm, Fayçal Boussouar, Hélène Humbertclaude, Sylvie Jounier, Jean-Christophe Aude, Céline Keime, Janos Murvai, Mario Foglio, Marta Gut, Ivo Gut, Mark Lathrop, Julie Soutourina, Matthieu Gérard, Michel Werner
Affiliations
- PMID: 21911356
- PMCID: PMC3245943
- DOI: 10.1093/nar/gkr737
Genomic binding of Pol III transcription machinery and relationship with TFIIS transcription factor distribution in mouse embryonic stem cells
Lucie Carrière et al. Nucleic Acids Res. 2012 Jan.
Abstract
RNA polymerase (Pol) III synthesizes the tRNAs, the 5S ribosomal RNA and a small number of untranslated RNAs. In vitro, it also transcribes short interspersed nuclear elements (SINEs). We investigated the distribution of Pol III and its associated transcription factors on the genome of mouse embryonic stem cells using a highly specific tandem ChIP-Seq method. Only a subset of the annotated class III genes was bound and thus transcribed. A few hundred SINEs were associated with the Pol III transcription machinery. We observed that Pol III and its transcription factors were present at 30 unannotated sites on the mouse genome, only one of which was conserved in human. An RNA was associated with >80% of these regions. More than 2200 regions bound by TFIIIC transcription factor were devoid of Pol III. These sites were associated with cohesins and often located close to CTCF-binding sites, suggesting that TFIIIC might cooperate with these factors to organize the chromatin. We also investigated the genome-wide distribution of the ubiquitous TFIIS variant, TCEA1. We found that, as in Saccharomyces cerevisiae, TFIIS is associated with class III genes and also with SINEs suggesting that TFIIS is a Pol III transcription factor in mammals.
Figures
Figure 1.
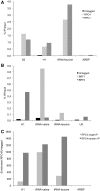
Chromatin immunoprecipitation of the Pol III transcription machinery in mouse ES cell lines. ChIP experiments were performed with the HA7 H-3663 anti-HA antibody (A and B) as described in ‘Materials and Methods’ section. (A) Chromatin extracts from RPC1 or RPC4 cell lines were used to show Pol III enrichment on different types of class III genes but not on the ARBP class II gene. (B) Extracts from BRF1 or BRF2 cell lines were used to demonstrate specific enrichment of TFIIIB-β or TFIIIB-α on genes with type 2 (tRNAs) or type 3 promoters (H1, U6), respectively. An untagged cell line was used as a negative control. (C) Tandem ChIPs improved signal to noise ratios. Single round ChIP (RPC4 single IP) were performed as above with HA7 H-3663 anti-HA antibody and were compared with experiments in which a second round (RPC4 tandem IP) of immunoprecipitation was done with F-1804 anti-Flag antibody after elution of proteins with an HA peptide. Enrichment-folds of sequences from an RPC4 ES cell line chromatin extract relative to an untagged cell line chromatin are indicated.
Figure 2.
Representative examples of sequence reads that map on bound regions. (A) Binding of Pol III and BRF1 to two tRNA genes and a SINE. The sequences that map to chromosome 11 are displayed using the UCSC genome browser. A 1 kb scale is shown at the top of the Figure. The sequence tags are represented by colored rectangles. Tags identified in the ChIP-Seq experiments performed with the RPC1-tagged, RPC4-tagged, BRF1-tagged or BRF2-tagged ES cell lines and 46C negative control cell line are colored in blue, yellow, red, green and gray, respectively. Light colors indicate the sequences that match the top strand. Dark colors indicate the tags that match the bottom strand. The location of repeated sequences, according to RepBase, is indicated at the bottom of the Figure by gray or black boxes. The two black boxes refer to two tRNA-Cys-TGY genes. The bound SINE is a PB1D7 repeat of the Alu family. (B) Binding of Pol III transcription machinery to an unannotated region on chromosome 3.
Figure 3.
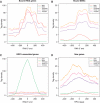
Distribution of Pol III, TBP, BRF1 and BRF2 relative to class III genes. Tag densities are shown for RPC1, RPC4, BRF1, BRF2 and TBP (45) relative to the location of the RNA 5′-end for (A) tRNA genes, (B) unbound tRNA genes, (C) SINEs, (D) BRF2-associated genes and (E) new class III genes. For these, neither the transcription orientation, nor the TSS or end is known. Hence, the distribution is shown relative to the RPC4 density peak.
Figure 4.
Distribution of TFIIIC relative to class III genes. Tag densities are shown for TFIIIC220, −110, −90, BRF1 and BRF2 relative to the location of the RNA 5′-end for (A) tRNA, (B) SINEs, (C) BRF2-associated. For the new class III genes (D) the distribution is shown relative to the RPC4 density peak.
Figure 5.
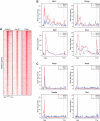
Distribution of CTCF, Smc1a, Smc3 relative to ETC-bound TFIIIC220. (A) Distribution of CTFC, Smc1a and Smc3, relative to TFIIIC220. The ETC regions bound by TFIIIC220 (C220) were ordered relative to their distance to CTFC-binding sites using seqMINER (63). The windows span 20 kb upstream and downstream the center of TFIIIC bound regions. The distribution of Smc1a and Smc3 on the same regions is shown on the two right panels according to the same order. (B) Distribution of CTCF, Smc1a and Smc3 relative to randomly selected regions. Randomly selected regions were sorted according to the distance of CTCF-binding site to the center of the region. Smc1a- and Smc3-binding sites are shown according to the same in the two right panels.
Figure 6.
Distribution of TCEA1 and Pol II relative to class III genes. Tag densities for RPC4, TCEA1 (this work) and the hypophosphorylated (RNAPII) (64), serine 2 (RNAPII_S2P) (54), serine 5 (RNAPII_S5P) and serine 7 (RNAPII_S7P) phosphorylated forms of Pol II, are shown relative to the location of the RNA 5′-end for bound (A) tRNA, (B) SINEs and (C) BRF2-associated genes. The tag density scale for RPC4 is indicated on the right side of the plots.
Figure 7.
Distribution of TCEA1 on class II genes. (A) Hypophosphorylated Pol II (RNAPII) and TCEA1 have similar distribution on genes. The distribution of Pol II, S5P Pol II and TCEA1 5 kb upstream and downstream of the TSS is plotted for the 10 000 most expressed genes in ES cells based on RNA-Seq (M.G., manuscript in preparation). The genes were ordered according to their expression levels using seqMINER. (B) Examples of Pol II and TCEA1 profiles on highly transcribed genes. TTS: Transcription termination site. (C) Examples of Pol II and TCEA1 profiles on paused unproductive genes.
Similar articles
- Distinct roles of transcription factors TFIIIB and TFIIIC in RNA polymerase III transcription reinitiation.
Ferrari R, Rivetti C, Acker J, Dieci G. Ferrari R, et al. Proc Natl Acad Sci U S A. 2004 Sep 14;101(37):13442-7. doi: 10.1073/pnas.0403851101. Epub 2004 Sep 3. Proc Natl Acad Sci U S A. 2004. PMID: 15347814 Free PMC article. - Absolute gene occupancies by RNA polymerase III, TFIIIB, and TFIIIC in Saccharomyces cerevisiae.
Soragni E, Kassavetis GA. Soragni E, et al. J Biol Chem. 2008 Sep 26;283(39):26568-76. doi: 10.1074/jbc.M803769200. Epub 2008 Jul 30. J Biol Chem. 2008. PMID: 18667429 Free PMC article. - Genome-wide location analysis reveals a role of TFIIS in RNA polymerase III transcription.
Ghavi-Helm Y, Michaut M, Acker J, Aude JC, Thuriaux P, Werner M, Soutourina J. Ghavi-Helm Y, et al. Genes Dev. 2008 Jul 15;22(14):1934-47. doi: 10.1101/gad.471908. Genes Dev. 2008. PMID: 18628399 Free PMC article. - TFIIIC bound DNA elements in nuclear organization and insulation.
Kirkland JG, Raab JR, Kamakaka RT. Kirkland JG, et al. Biochim Biophys Acta. 2013 Mar-Apr;1829(3-4):418-24. doi: 10.1016/j.bbagrm.2012.09.006. Epub 2012 Sep 21. Biochim Biophys Acta. 2013. PMID: 23000638 Free PMC article. Review. - Extra-transcriptional functions of RNA Polymerase III complexes: TFIIIC as a potential global chromatin bookmark.
Donze D. Donze D. Gene. 2012 Feb 10;493(2):169-75. doi: 10.1016/j.gene.2011.09.018. Epub 2011 Oct 1. Gene. 2012. PMID: 21986035 Review.
Cited by
- Nuclear organization and genome function.
Van Bortle K, Corces VG. Van Bortle K, et al. Annu Rev Cell Dev Biol. 2012;28:163-87. doi: 10.1146/annurev-cellbio-101011-155824. Epub 2012 Aug 17. Annu Rev Cell Dev Biol. 2012. PMID: 22905954 Free PMC article. Review. - Regulation of pol III transcription by nutrient and stress signaling pathways.
Moir RD, Willis IM. Moir RD, et al. Biochim Biophys Acta. 2013 Mar-Apr;1829(3-4):361-75. doi: 10.1016/j.bbagrm.2012.11.001. Epub 2012 Nov 16. Biochim Biophys Acta. 2013. PMID: 23165150 Free PMC article. Review. - Biosynthesis of brain cytoplasmic 200 RNA.
Kim Y, Lee J, Shin H, Jang S, Kim SC, Lee Y. Kim Y, et al. Sci Rep. 2017 Jul 31;7(1):6884. doi: 10.1038/s41598-017-05097-3. Sci Rep. 2017. PMID: 28761139 Free PMC article. - Widespread Backtracking by RNA Pol II Is a Major Effector of Gene Activation, 5' Pause Release, Termination, and Transcription Elongation Rate.
Sheridan RM, Fong N, D'Alessandro A, Bentley DL. Sheridan RM, et al. Mol Cell. 2019 Jan 3;73(1):107-118.e4. doi: 10.1016/j.molcel.2018.10.031. Epub 2018 Nov 29. Mol Cell. 2019. PMID: 30503775 Free PMC article. - RNA Polymerase III Subunit Mutations in Genetic Diseases.
Lata E, Choquet K, Sagliocco F, Brais B, Bernard G, Teichmann M. Lata E, et al. Front Mol Biosci. 2021 Jul 30;8:696438. doi: 10.3389/fmolb.2021.696438. eCollection 2021. Front Mol Biosci. 2021. PMID: 34395528 Free PMC article. Review.
References
- Dieci G, Fiorino G, Castelnuovo M, Teichmann M, Pagano A. The expanding RNA polymerase III transcriptome. Trends Genet. 2007;23:614–622. - PubMed
- Kramerov DA, Vassetzky NS. Short retroposons in eukaryotic genomes. Int. Rev. Cytol. 2005;247:165–221. - PubMed
- White RJ. RNA Polymerase III Transcription. 2nd edn. Berlin: Springer; 1998.
- Schramm L, Hernandez N. Recruitment of RNA polymerase III to its target promoters. Genes Dev. 2002;16:2593–2620. - PubMed
Publication types
MeSH terms
Substances
LinkOut - more resources
Full Text Sources
Molecular Biology Databases


