Mouse genomic variation and its effect on phenotypes and gene regulation - PubMed (original) (raw)
Comparative Study
. 2011 Sep 14;477(7364):289-94.
doi: 10.1038/nature10413.
Leo Goodstadt, Petr Danecek, Michael A White, Kim Wong, Binnaz Yalcin, Andreas Heger, Avigail Agam, Guy Slater, Martin Goodson, Nicholas A Furlotte, Eleazar Eskin, Christoffer Nellåker, Helen Whitley, James Cleak, Deborah Janowitz, Polinka Hernandez-Pliego, Andrew Edwards, T Grant Belgard, Peter L Oliver, Rebecca E McIntyre, Amarjit Bhomra, Jérôme Nicod, Xiangchao Gan, Wei Yuan, Louise van der Weyden, Charles A Steward, Sendu Bala, Jim Stalker, Richard Mott, Richard Durbin, Ian J Jackson, Anne Czechanski, José Afonso Guerra-Assunção, Leah Rae Donahue, Laura G Reinholdt, Bret A Payseur, Chris P Ponting, Ewan Birney, Jonathan Flint, David J Adams
Affiliations
- PMID: 21921910
- PMCID: PMC3276836
- DOI: 10.1038/nature10413
Comparative Study
Mouse genomic variation and its effect on phenotypes and gene regulation
Thomas M Keane et al. Nature. 2011.
Abstract
We report genome sequences of 17 inbred strains of laboratory mice and identify almost ten times more variants than previously known. We use these genomes to explore the phylogenetic history of the laboratory mouse and to examine the functional consequences of allele-specific variation on transcript abundance, revealing that at least 12% of transcripts show a significant tissue-specific expression bias. By identifying candidate functional variants at 718 quantitative trait loci we show that the molecular nature of functional variants and their position relative to genes vary according to the effect size of the locus. These sequences provide a starting point for a new era in the functional analysis of a key model organism.
Figures
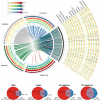
Figure 1. An overview of variants called from 17 mouse genomes relative to the reference
a, The four wild strains (CAST/EiJ, WSB/EiJ, PWK/PhJ and SPRET/EiJ) are representative of the Mus musculus castaneus, Mus musculus musculus, Mus musculus domesticus and Mus spretus taxa and include the progenitors from which the classical laboratory strains were derived. These genomes are shown in a circle with tracks indicating the relative density of SNPs, structural variants (SVs) and uncallable regions (binned into 10-Mb regions). Transposable element (TE) insertions, which are a subset of the structural variant calls, are shown as a separate track. Corresponding tracks are shown for each of the 13 classical laboratory strains to the right of the circle. Links crossing the circle indicate regions on the reference where the wild strain is closest to the reference (375-kb bins). b, The numbers inside the Venn diagrams indicate the number of SNPs, indels, structural variant deletions and transposable element insertions in the wild and classical laboratory strains. The numbers beneath each Venn diagram indicate totals for each type of variant in the wild and classical laboratory strains.
Figure 2. Genomic partitioning of phylogenetic history
Bayesian concordance factors were estimated from 43,255 individual locus trees. 87.9% of the genes place M. spretus (Spret) and rat as the outgroup to the M. musculus subspecies. Within the M. musculus subspecies, there is a primary history supporting a M. m. musculus (Musc)/M. m. castaneus (Cast) sister relationship (37.9%) with M. m. domesticus (Dom) branching off first. The two alternative topologies are supported by equal percentages of the genome (30.3% and 30.2%). 95% credibility intervals on all estimates are ± 0.001.
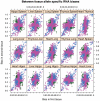
Figure 3. Allele-specific biases in RNA expression levels between tissues from C57BL/6J x DBA/2J F1 mice
RNA was sequenced from six tissues: hippocampus (hippo), spleen, liver, heart, lung and thymus. Each point represents a gene, and the bias ranges from 1.0 (exclusively C57BL/6J) to 0.0 (exclusively DBA/2J). The tissue comparison is shown above each plot. The points are coloured by whether the difference in bias is not significant (blue), significantly different bias but in the same direction (pink) or significantly different but switching direction (green).
Figure 4. Enrichment of functional variants
Each line shows the ratio of the percentage of functional variants at a QTL over the percentage of variants expected. Ratios greater than one indicate that functional variants are enriched in a classification and ratios less than one indicate a dearth of functional variants. Functional variants are classified by their position relative to a gene and by their molecular class: SNPs, structural variants and insertion/deletions (indels) polymorphisms.
Comment in
- Genomic variation in the mouse.
Hardiman G. Hardiman G. Pharmacogenomics. 2011 Dec;12(12):1638-9. Pharmacogenomics. 2011. PMID: 22224210 No abstract available.
Similar articles
- Using whole-genome sequences of the LG/J and SM/J inbred mouse strains to prioritize quantitative trait genes and nucleotides.
Nikolskiy I, Conrad DF, Chun S, Fay JC, Cheverud JM, Lawson HA. Nikolskiy I, et al. BMC Genomics. 2015 May 28;16(1):415. doi: 10.1186/s12864-015-1592-3. BMC Genomics. 2015. PMID: 26016481 Free PMC article. - Sequence-based characterization of structural variation in the mouse genome.
Yalcin B, Wong K, Agam A, Goodson M, Keane TM, Gan X, Nellåker C, Goodstadt L, Nicod J, Bhomra A, Hernandez-Pliego P, Whitley H, Cleak J, Dutton R, Janowitz D, Mott R, Adams DJ, Flint J. Yalcin B, et al. Nature. 2011 Sep 14;477(7364):326-9. doi: 10.1038/nature10432. Nature. 2011. PMID: 21921916 Free PMC article. - The abundance of cis-acting loci leading to differential allele expression in F1 mice and their relationship to loci harboring genes affecting complex traits.
Yeo S, Hodgkinson CA, Zhou Z, Jung J, Leung M, Yuan Q, Goldman D. Yeo S, et al. BMC Genomics. 2016 Aug 11;17(1):620. doi: 10.1186/s12864-016-2922-9. BMC Genomics. 2016. PMID: 27515598 Free PMC article. - A novel strategy for genetic dissection of complex traits: the population of specific chromosome substitution strains from laboratory and wild mice.
Xiao J, Liang Y, Li K, Zhou Y, Cai W, Zhou Y, Zhao Y, Xing Z, Chen G, Jin L. Xiao J, et al. Mamm Genome. 2010 Aug;21(7-8):370-6. doi: 10.1007/s00335-010-9270-x. Epub 2010 Jul 11. Mamm Genome. 2010. PMID: 20623355 Review.
Cited by
- Whole genome sequencing of CRISPR/Cas9-engineered NF-κB reporter mice for validation and variant discovery.
Mahesh G, Martin EW, Aqdas M, Oh KS, Sung MH. Mahesh G, et al. Sci Data. 2024 Nov 13;11(1):1225. doi: 10.1038/s41597-024-04064-8. Sci Data. 2024. PMID: 39537647 Free PMC article. - How can ethology inform the neuroscience of fear, aggression and dominance?
Battivelli D, Fan Z, Hu H, Gross CT. Battivelli D, et al. Nat Rev Neurosci. 2024 Dec;25(12):809-819. doi: 10.1038/s41583-024-00858-2. Epub 2024 Oct 14. Nat Rev Neurosci. 2024. PMID: 39402310 Review. - Multiparametric Assays Capture Sex- and Environment-Dependent Modifiers of Behavioral Phenotypes in Autism Mouse Models.
Wahl L, Karim A, Hassett AR, van der Doe M, Dijkhuizen S, Badura A. Wahl L, et al. Biol Psychiatry Glob Open Sci. 2024 Jul 20;4(6):100366. doi: 10.1016/j.bpsgos.2024.100366. eCollection 2024 Nov. Biol Psychiatry Glob Open Sci. 2024. PMID: 39262819 Free PMC article. - Validation studies and multi-omics analysis of Zhx2 as a candidate quantitative trait gene underlying brain oxycodone metabolite (oxymorphone) levels and behavior.
Lynch WB, Miracle SA, Goldstein SI, Beierle JA, Bhandari R, Gerhardt ET, Farnan A, Nguyen BM, Wingfield KK, Kazerani I, Saavedra GA, Averin O, Baskin BM, Ferris MT, Reilly CA, Emili A, Bryant CD. Lynch WB, et al. bioRxiv [Preprint]. 2024 Sep 1:2024.08.30.610534. doi: 10.1101/2024.08.30.610534. bioRxiv. 2024. PMID: 39257803 Free PMC article. Preprint. - An integrated transcription factor framework for Treg identity and diversity.
Chowdhary K, Léon J, Mathis D, Benoist C. Chowdhary K, et al. Proc Natl Acad Sci U S A. 2024 Sep 3;121(36):e2411301121. doi: 10.1073/pnas.2411301121. Epub 2024 Aug 28. Proc Natl Acad Sci U S A. 2024. PMID: 39196621
References
- Dietrich WF, et al. Genetic identification of Mom-1, a major modifier locus affecting Min-induced intestinal neoplasia in the mouse. Cell. 1993;75:631–639. - PubMed
- Chinwalla AT, et al. Initial sequencing and comparative analysis of the mouse genome. Nature. 2002;420:520–562. - PubMed
Publication types
MeSH terms
Grants and funding
- 077192/WT_/Wellcome Trust/United Kingdom
- MC_EX_G0802457/MRC_/Medical Research Council/United Kingdom
- MC_U137761446/MRC_/Medical Research Council/United Kingdom
- K25 HL080079/HL/NHLBI NIH HHS/United States
- T15 LM007359/LM/NLM NIH HHS/United States
- BB/F022697/1/BB_/Biotechnology and Biological Sciences Research Council/United Kingdom
- WT_/Wellcome Trust/United Kingdom
- 079912/WT_/Wellcome Trust/United Kingdom
- 085906/Z/08/Z/WT_/Wellcome Trust/United Kingdom
- N01AI15416/AI/NIAID NIH HHS/United States
- G0800024/MRC_/Medical Research Council/United Kingdom
- 083573/Z/07/Z/WT_/Wellcome Trust/United Kingdom
- 082356/WT_/Wellcome Trust/United Kingdom
- 083573/WT_/Wellcome Trust/United Kingdom
- T32 HG002536/HG/NHGRI NIH HHS/United States
- A6997/CRUK_/Cancer Research UK/United Kingdom
- 090532/WT_/Wellcome Trust/United Kingdom
- MC_U127561112/MRC_/Medical Research Council/United Kingdom
- 085906/WT_/Wellcome Trust/United Kingdom
- 2T15LM007359/LM/NLM NIH HHS/United States
LinkOut - more resources
Full Text Sources
Other Literature Sources
Molecular Biology Databases


