Chromosome catastrophes involve replication mechanisms generating complex genomic rearrangements - PubMed (original) (raw)
. 2011 Sep 16;146(6):889-903.
doi: 10.1016/j.cell.2011.07.042.
Ayelet Erez, Sandesh C Sreenath Nagamani, Shweta U Dhar, Katarzyna E Kołodziejska, Avinash V Dharmadhikari, M Lance Cooper, Joanna Wiszniewska, Feng Zhang, Marjorie A Withers, Carlos A Bacino, Luis Daniel Campos-Acevedo, Mauricio R Delgado, Debra Freedenberg, Adolfo Garnica, Theresa A Grebe, Dolores Hernández-Almaguer, LaDonna Immken, Seema R Lalani, Scott D McLean, Hope Northrup, Fernando Scaglia, Lane Strathearn, Pamela Trapane, Sung-Hae L Kang, Ankita Patel, Sau Wai Cheung, P J Hastings, Paweł Stankiewicz, James R Lupski, Weimin Bi
Affiliations
- PMID: 21925314
- PMCID: PMC3242451
- DOI: 10.1016/j.cell.2011.07.042
Chromosome catastrophes involve replication mechanisms generating complex genomic rearrangements
Pengfei Liu et al. Cell. 2011.
Abstract
Complex genomic rearrangements (CGRs) consisting of two or more breakpoint junctions have been observed in genomic disorders. Recently, a chromosome catastrophe phenomenon termed chromothripsis, in which numerous genomic rearrangements are apparently acquired in one single catastrophic event, was described in multiple cancers. Here, we show that constitutionally acquired CGRs share similarities with cancer chromothripsis. In the 17 CGR cases investigated, we observed localization and multiple copy number changes including deletions, duplications, and/or triplications, as well as extensive translocations and inversions. Genomic rearrangements involved varied in size and complexities; in one case, array comparative genomic hybridization revealed 18 copy number changes. Breakpoint sequencing identified characteristic features, including small templated insertions at breakpoints and microhomology at breakpoint junctions, which have been attributed to replicative processes. The resemblance between CGR and chromothripsis suggests similar mechanistic underpinnings. Such chromosome catastrophic events appear to reflect basic DNA metabolism operative throughout an organism's life cycle.
Copyright © 2011 Elsevier Inc. All rights reserved.
Figures
Figure 1
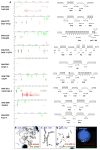
Cases with complex rearrangements identified by clinical CMA. (A) Array CGH data for subjects on the left with the interpreted rearrangement patterns depicted on the right. The piled rectangles depict copy number status for the region (one for deletion, two for normal diploid copy, three for duplication, and four for triplication). The V-shaped lines connecting different segments indicate regions of unknown copy number state due to lack of interrogating oligonucleotide coverage in the array. (B)–(E) Representative FISH and chromosome analyses independently confirm the CMA findings and provide positional information. The chromosomes with rearrangements are indicated by arrows. (B) Metaphase FISH analysis using two probes located within the duplications show that the rearrangement was within a ring chromosome 6 in BAB2778. (C)–(D) G-banded chromosome (C) and FISH (D) analyses using two probes within the two duplications show that neither of the two individual duplicated segments appear to be simple tandem events; subsequent sequence analysis demonstrated that one duplication in BAB2780 is inserted in between the other duplication. (E) Interphase FISH analysis revealed three red signals, which confirmed the triplication in BAB3050. The BAC probes used were indicated. See Figure S1 for additional rearrangements with CMA results indicating a duplication next to a terminal deletion.
Figure 2
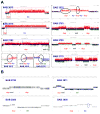
Characterization of the rearrangements using high density arrays. (A) Array CGH using customized Agilent arrays. Copy number changes (indicated by black circles) in addition to the ones detected by clinical CMA were seen for patients BAB3012, 3015, 3103, and 3032. The boxed regions were enlarged in the left bottom panels. For both BAB3012 and 3015, a small duplication was detected proximal and next to the triplicated regions. For BAB3103, a 7.9 kb normal copy sequence was detected between the terminal deletion and the duplicated segment. BAB3032 had a trp-dup rearrangement revealed by CMA. High-density array showed a duplication proximal to the triplication and a 18 kb duplication within the triplicated segment. (B) Array CGH using Nimblegen 4.2 M arrays. BAB3050 had a dup-trp rearrangement identified by CMA. High density array showed a 40 kb duplication within the triplicated segment which was highlighted in a blue circle. This duplication is within a CNV in the database of genomic variants, and most likely is not part of the complex event, but rather reflects relative signal intensities from a benign CNV. See also Table S2.
Figure 3
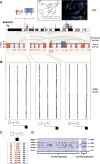
Highly complex rearrangements in BAB3105. (A) Schematic drawing of copy number and rearrangement structure profiles on chromosome 9q summarized from aCGH, FISH and G-banded chromosome analysis results. Bars (red for duplication and blue for triplication) above the chromosome ideogram and piled rectangular boxes below the ideogram represent the copy number states for each genomic segment. The sizes of the rearrangements and normal copy number intervals are listed in megabases. The arrows indicate translocations (upward facing) and insertions (downward facing) as indicated by FISH analysis using locus-specific BAC clones. All these additional segments of the 5.1 Mb duplication, 2.1 Mb duplication, 0.78 Mb duplication, 1.4 Mb duplication, and 5.5 Mb triplication were translocated close to the pericentric region, proximal to the original location of the 2.1 Mb duplication region. The orders of these additional segments are deduced from FISH results. It is unknown whether the additional 1.4 Mb duplicated segment is located proximal to or between the two copies of the 5.5 Mb triplicate segments. Two representative FISH images are shown (Figure 3A). The FISH image on the left shows that the duplicated (RP11-35N6) and triplicated (RP11-18B16) segments in 9q31-q33 were translocated close to the 9q21 region. The FISH image on the right shows that the two additional copies of the 5.5 Mb triplication marked by an arrow are in an inverted orientation with each other. RP11-203L12 is mapped at distal end and RP11-104M22 is mapped at the proximal end of the triplicated segment. Note that the additional complexities of the rearranged chromosome are represented as curvilinear connections of breakpoint regions. The purple curves indicate junctions between two segments with copy number gain revealed by breakpoint sequencing. (B) Nimblegen 4.2M aCGH plots for the trio. The displayed regions correspond to the regions in (A). Parental aCGH analyses demonstrated that all the copy number changes were de novo. Triplication was indicated by blue and duplication was indicated by red. The pedigrees are on the bottom. (C) Representative SNP transmission patterns that suggest a paternal interchromosome origin of the rearrangements. (D) Zoomed-in view of the SNP array data for the 5.5 Mb triplication and the 0.78 Mb duplication in BAB3105. Five different genotypes are observed across the entire triplicated region. See also Figure S2
Figure 4
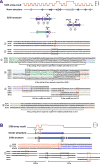
Representative breakpoint sequences. In each panel, the top graph shows schematic representation of the aCGH result. Regions of copy number gains are highlighted in red. The sizes of different segments are not in proportion to the actual rearrangement size. Below the array result is the schematic diagram illustrating the structure of a reference genomic region corresponding to the region in the array result. Below the reference structure is the proposed rearranged structure in the patient, which is surmised from breakpoint sequencing data. Specific breakpoint sequences and alignments to the reference sequences are shown below. Reference sequences are named as PLUS, MINUS, PLU1 (plus1), and MIN1 (minus1), etc. in order to indicate the orientation of DNA strand. A transition between the plus and minus strands within a breakpoint indicates that such a rearrangement causes an inversion. Microhomologies found at the breakpoints are boxed in red, whereas short sequences insertions at the breakpoints with no microhomology are boxed in black. (A) BAB3105. Six breakpoint junctions were obtained, providing information about their relative positions in the rearranged chromosome. In breakpoints #3–6, novel sequence insertions, ranging from 54–1542 bp, were identified at the fusion point. (B) BAB2870. In breakpoint junction #2, a 406 bp and a 90 bp segments copied from nearby genomic sequences are inserted. There is one 8 bp novel sequence inserted within the 90 bp segment (green). See also Figure S3.
Figure 5
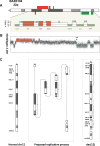
Highly complex rearrangements in BAB3104. (A) Copy number profiles in BAB3104 revealed by aCGH. Deletions are shown in green and duplications in red. (B) Nimblegen 2.1M aCGH plot in BAB3104. Note that a 23 kb copy number normal region is indicated by an arrow. (C) The rearrangement structure in BAB3104 proposed based on multiple FISH results. To the left is an ideogram of a normal chromosome 22. Shown in middle is the proposed replicative process that produced the genomic imbalances. The segments involving rearrangement are indicated by colored brackets. The figure to the right shows the derivative chromosome 22 with the segments involved in the final order based on FISH analyses. The mapping positions of FISH BAC RP11- probes used are indicated. The orientation of these segments is not certain. See also Figure S4.
Figure 6
Highly complex rearrangements in patient 1 and patient 2. Copy number profiles and schematic drawings of the genomic rearrangements are shown on chromosome 1q for patient 1 (A) and chromosome 22q for patient 2 (B). Structural changes are revealed by FISH or G-banded chromosome analyses. Insertional translocations are indicated by arrows. Inversion in patient 1 is indicated by a curly bracket. See Figure S5 for aCGH, FISH, and chromosome analyses data.
Similar articles
- Breakpoint profiling of 64 cancer genomes reveals numerous complex rearrangements spawned by homology-independent mechanisms.
Malhotra A, Lindberg M, Faust GG, Leibowitz ML, Clark RA, Layer RM, Quinlan AR, Hall IM. Malhotra A, et al. Genome Res. 2013 May;23(5):762-76. doi: 10.1101/gr.143677.112. Epub 2013 Feb 14. Genome Res. 2013. PMID: 23410887 Free PMC article. - A Distinct Class of Chromoanagenesis Events Characterized by Focal Copy Number Gains.
Masset H, Hestand MS, Van Esch H, Kleinfinger P, Plaisancié J, Afenjar A, Molignier R, Schluth-Bolard C, Sanlaville D, Vermeesch JR. Masset H, et al. Hum Mutat. 2016 Jul;37(7):661-8. doi: 10.1002/humu.22984. Epub 2016 Apr 6. Hum Mutat. 2016. PMID: 26936114 - Further delineation of nonhomologous-based recombination and evidence for subtelomeric segmental duplications in 1p36 rearrangements.
D'Angelo CS, Gajecka M, Kim CA, Gentles AJ, Glotzbach CD, Shaffer LG, Koiffmann CP. D'Angelo CS, et al. Hum Genet. 2009 Jun;125(5-6):551-63. doi: 10.1007/s00439-009-0650-9. Epub 2009 Mar 7. Hum Genet. 2009. PMID: 19271239 - Processes shaping cancer genomes - From mitotic defects to chromosomal rearrangements.
Keuper K, Wieland A, Räschle M, Storchova Z. Keuper K, et al. DNA Repair (Amst). 2021 Nov;107:103207. doi: 10.1016/j.dnarep.2021.103207. Epub 2021 Aug 10. DNA Repair (Amst). 2021. PMID: 34425515 Review. - Chromothripsis in congenital disorders and cancer: similarities and differences.
Kloosterman WP, Cuppen E. Kloosterman WP, et al. Curr Opin Cell Biol. 2013 Jun;25(3):341-8. doi: 10.1016/j.ceb.2013.02.008. Epub 2013 Mar 13. Curr Opin Cell Biol. 2013. PMID: 23478216 Review.
Cited by
- Cohesin subunit RAD21: From biology to disease.
Cheng H, Zhang N, Pati D. Cheng H, et al. Gene. 2020 Oct 20;758:144966. doi: 10.1016/j.gene.2020.144966. Epub 2020 Jul 17. Gene. 2020. PMID: 32687945 Free PMC article. Review. - FOXM1 coming of age: time for translation into clinical benefits?
Teh MT. Teh MT. Front Oncol. 2012 Oct 15;2:146. doi: 10.3389/fonc.2012.00146. eCollection 2012. Front Oncol. 2012. PMID: 23087907 Free PMC article. - Chromothripsis Challenges the Germline.
Poot M. Poot M. Mol Syndromol. 2012 Sep;3(3):99-101. doi: 10.1159/000341255. Epub 2012 Jul 25. Mol Syndromol. 2012. PMID: 23112751 Free PMC article. No abstract available. - Starvation-associated genome restructuring can lead to reproductive isolation in yeast.
Kroll E, Coyle S, Dunn B, Koniges G, Aragon A, Edwards J, Rosenzweig F. Kroll E, et al. PLoS One. 2013 Jul 24;8(7):e66414. doi: 10.1371/journal.pone.0066414. Print 2013. PLoS One. 2013. PMID: 23894280 Free PMC article. - Chromothripsis: chromosomes in crisis.
Jones MJ, Jallepalli PV. Jones MJ, et al. Dev Cell. 2012 Nov 13;23(5):908-17. doi: 10.1016/j.devcel.2012.10.010. Dev Cell. 2012. PMID: 23153487 Free PMC article. Review.
References
- Bailey JA, Gu Z, Clark RA, Reinert K, Samonte RV, Schwartz S, Adams MD, Myers EW, Li PW, Eichler EE. Recent segmental duplications in the human genome. Science. 2002;297:1003–1007. - PubMed
- Batista DA, Pai GS, Stetten G. Molecular analysis of a complex chromosomal rearrangement and a review of familial cases. Am J Med Genet. 1994;53:255–263. - PubMed
- Borg K, Stankiewicz P, Bocian E, Kruczek A, Obersztyn E, Lupski JR, Mazurczak T. Molecular analysis of a constitutional complex genome rearrangement with 11 breakpoints involving chromosomes 3, 11, 12, and 21 and a approximately 0.5-Mb submicroscopic deletion in a patient with mild mental retardation. Hum Genet. 2005;118:267–275. - PubMed
Publication types
MeSH terms
Grants and funding
- R01 GM064022/GM/NIGMS NIH HHS/United States
- P30 HD024064-24/HD/NICHD NIH HHS/United States
- K08 DK081735-04/DK/NIDDK NIH HHS/United States
- M01 RR000188/RR/NCRR NIH HHS/United States
- R01 NS058529-04/NS/NINDS NIH HHS/United States
- P30 HD024064/HD/NICHD NIH HHS/United States
- DK081735-02/DK/NIDDK NIH HHS/United States
- K08 DK081735/DK/NIDDK NIH HHS/United States
- P30HD024064/HD/NICHD NIH HHS/United States
- R01 NS058529/NS/NINDS NIH HHS/United States
- R01 GM064022-08/GM/NIGMS NIH HHS/United States
LinkOut - more resources
Full Text Sources
Other Literature Sources
Medical
