NMDA mediated contextual conditioning changes miRNA expression - PubMed (original) (raw)
NMDA mediated contextual conditioning changes miRNA expression
Min Jeong Kye et al. PLoS One. 2011.
Abstract
We measured the expression of 187 miRNAs using quantitative real time PCR in the hippocampal CA1 region of contextually conditioned mice and cultured embryonic rat hippocampal neurons after neuronal stimulation with either NMDA or bicuculline. Many of the changes in miRNA expression after these three types of stimulation were similar. Surprisingly, the expression level of half of the 187 measured miRNAs was changed in response to contextual conditioning in an NMDA receptor-dependent manner. Genes that control miRNA biogenesis and components of the RISC also exhibited activity induced expression changes and are likely to contribute to the widespread changes in the miRNA profile. The widespread changes in miRNA expression are consistent with the finding that genes up-regulated by contextual conditioning have longer 3' UTRs and more predicted binding sites for miRNAs. Among the miRNAs that changed their expression after contextual conditioning, several inhibit inhibitors of the mTOR pathway. These findings point to a role for miRNAs in learning and memory that includes mTOR-dependent modulation of protein synthesis.
Conflict of interest statement
Competing Interests: The authors have declared that no competing interests exist.
Figures
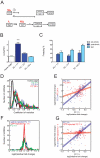
Figure 1. Contextual conditioning induces NMDA-dependent wide scale changes in the global miRNA profile.
(A) Schematic of the experimental design. Mice were trained and memory tested. CA1 region was removed at 1, 3 and 24 hours after fear conditioning (FC). CPP was injected 30 min prior contextual conditioning. (B) Relative Arc transcript levels in CA1 region after training (*** p<0.001, t-test, home cage: n = 12, 1 h and 3 h: n = 12, 24 h: n = 8, mean ± S.E.M.) (C) Contextual fear memory tests at 1, 3, and 24 hr after training. Freezing before (pre-shock) and immediately after shock (post-shock) during the training are also shown. (D) Coefficient of variation of 184 miRNA levels from CA1 region of home caged or fear conditioned animals (1, 3 and 24 hours after training). miRNA levels were more heterogeneous after FC (p<10−14, Kruskal-Wallis test). (E) Comparison of the relative expression changes for individual miRNAs at 3 (blue dots and blue line) and 24 h (red dots and red line) after FC with 1 h after FC. Solid lines are linear fits of the data. Changes were correlated between 1 and 3 h (rS = 0.71, p = 3.10−26) and 24 h (rS = 0.38, p = 7.10−7). (F) Relative mean expression changes of 187 miRNAs 1 h after FC with an injection of a saline solution (blue), of CPP, an NMDA receptor antagonist (red) or without any injection (green). Levels were compared to those of naive animals. Saline-injected and CPP-injected distributions were significantly different (p = 0.02, Kolmogorov-Smirnov test), the distribution of CPP-injected profile is sharper than the saline-injected one (p<10−6, F-test). (G) Comparison of the expression changes 1 h after FC with 3 h after FC (blue dots and blue line) or with injection of the NMDA receptor antagonist, D(–)-3-(2-carboxypiperazine-4-yl)-propyl-1-phosphonic acid (CPP) (red dots and red line). Levels were compared to those of naive animals. Changes in the presence of CPP were minimal and uncorrelated with the ones in conditioned animals (r = 0.06, p = 0.44). The solid line is a linear fit of the data.
Figure 2. miRNA temporal expression patterns after conditioning in hippocampal CA1 region.
(A) Three heatmaps of miRNA expression after contextual conditioning. They are organized based on time after contextual conditioning. up; 1 h, middle; 3 hrs, down; 24 hrs. (colored miRNAs are statistically significant, n.s. = not significant). (B) Diagram of miRNAs changing after contextual fear conditioning (FC) (p<0.05, Kruskal-Wallis test, home cage: n = 20, 1 h and 3 h: n = 12, 24 h: n = 8.)
Figure 3. miRNA expression patterns 1 hour after chemical stimulation with NMDA and bicuculline to 15 days cultured rat embryonic hippocampal neurons.
(A) Relative ARC transcript levels are increased after stimulation with NMDA or bicuculline. (*p<0.05, ***p<0.001, t-test, mean ± S.E.M.). (B) Mean relative fold changes compared to unstimulated neurons were computed for each stimulation method. The amplitude of expression changes was remarkably correlated. (rS = 0.81, p = 7.10−41). (C) miRNAs with expression significantly different from the one in unstimulated neurons. (p<0.05, Kruskal-Wallis test). (D) 32 miRNAs showed expression changes in common after NMDA and bicuculline stimulation. (unstimulated; n = 10, NMDA; n = 10, 60 µM, 5 min treatment, bicuculline; n = 8, 20 µM, 1 hour treatment).
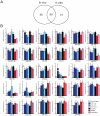
Figure 4. The expressions of 29 miRNAs are changed in vivo and in vitro in response to contextual conditioning and neuronal stimulation.
(A) Diagram of miRNAs changing their expression after contextual fear conditioning (FC) and neuronal stimulation. 90 miRNAs are changing after FC in vivo in the CA1 region and 91 miRNAs are changing after neuronal stimulation in the culture system. (B) 14 miRs are increased and 15 miRs are decreased in both FC and neuronal stimulation at least in one condition per group. Statistical significance was marked with asterisk. (* p<0.05, Kruskal-Wallis test).
Figure 5. miRNA and pri-miRNA expression levels are largely uncoupled.
(A–C) Up-regulated mature miRNAs have unchanged pri-miRNA levels. (D, E) Down-regulated mature miRNAs showing relatively unchanged pri-miRNA levels, (F) Both mature and pri-miRNA levels are down-regulated (G, H) Only pri-miRNAs are up-regulated (I) Both mature and pri-miRNAs are not changed after fear conditioning (FC). (* p<0.05, Man-Whitney test, home cage: n = 12, 1 h and 3 h: n = 12, 24 h: n = 8, mean ± S.E.M.).
Figure 6. Contextual conditioning affects transcript levels of miRNA biogenesis enzymes and RISC components.
(A) Transcript levels of DGCR8, Drosha, Dicer1, Ago1, Mov10 and GW182 in vivo hippocampal CA1 region after contextual fear conditioning. (*p<0.05, ANOVA, home cage: n = 12, 1 h and 3 h: n = 12, 24 h: n = 8. normalized by GAPDH, mean ± S.E.M.) FC = fear conditioning. (B) Transcript levels of DGCR8, Drosha, Dicer1, Ago1, Mov10 and GW182 in in vitro cultured neurons after stimulation with NMDA or bicuculline. (*p<0.05, t-test, n = 8 per group from four different biological samples, normalized by GAPDH, mean ± S.E.M.) (C) Protein levels of DGCR8 and Drosha after neuronal activation. (*p<0.05, t-test, n = 3 from three different biological samples, normalized by GAPDH, mean ± S.E.M.).
Figure 7. Up-regulates genes with more predicted miRNA sites.
(A) Number of predicted miRNA binding sites in the 3′ UTR of genes up-regulated or down-regulated after fear conditioning (FC) (B) after context exposure only (C) shock only (microarray data from Peleg et al. (2010), Blue; up-, Red; down- regulated genes after FC, Green; every gene in Targetscan as a control.). (p<0.05, ANOVA, home cage: n = 12, 1 h and 3 h: n = 12, 24 h: n = 8. mean ± S.E.M.).
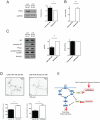
Figure 8. miR-19b regulates mTORC1 activity in neurons.
Cultured hippocampal neurons were transiently transfected with either complementary sequence based locked nucleic acid inhibitors of miR-19b or a scrambled control in DIV1 (50 nM). In DIV5, RNA and protein lysates were collected and mTOR activity as well as the level of miR-19b was measured. (A) Western blot of PTEN as a miR-19b target gene. About 30% of protein is increased in miR-19b knock down neurons. *p<0.05, t-test, n = 7 from seven different biological samples. (B) Level of miR-19b was less than 0.1% in DIV5 neurons. n = 6 from three different biological samples, Student’s t-test, *** p<0.001. (C) Western blot of genes in the mTOR pathway. Inhibition of miR-19b reduced phospho-S6/S6 ratio representing mTORC1 activity. Inhibition of miR-19b didn’t change phospho-PKCa/PKCa ratio, representing mTORC2 activity. Student’s t-test ** p<0.01, n = 8 from 4 different biological samples. (D) Tau+ staining of neurons after 5 days of transfection. Longest and total neurite lengths were reduced in miR-19b knock down neurons. Scale bar = 100 µm, Student’s t-test, *** p<0.001, n = 50 neurons per group. (E) Model: miRNAs that are up-regulated after contextual conditioning and neuronal stimulation regulate genes in the mTOR pathway. Red arrow indicates miRNA related mTOR pathways activated after contextual conditioning and neuronal stimulation.
Similar articles
- Exploring MicroRNA Expression Profiles Related to the mTOR Signaling Pathway in Mouse Embryonic Fibroblast Cells Treated with Polyethylenimine.
Lin CW, Jan MS, Kuo JH. Lin CW, et al. Mol Pharm. 2015 Aug 3;12(8):2858-68. doi: 10.1021/acs.molpharmaceut.5b00329. Epub 2015 Jul 21. Mol Pharm. 2015. PMID: 26158199 - MicroRNA regulation of the synaptic plasticity-related gene Arc.
Wibrand K, Pai B, Siripornmongcolchai T, Bittins M, Berentsen B, Ofte ML, Weigel A, Skaftnesmo KO, Bramham CR. Wibrand K, et al. PLoS One. 2012;7(7):e41688. doi: 10.1371/journal.pone.0041688. Epub 2012 Jul 26. PLoS One. 2012. PMID: 22844515 Free PMC article. - The relationship between the evolution of microRNA targets and the length of their UTRs.
Cheng C, Bhardwaj N, Gerstein M. Cheng C, et al. BMC Genomics. 2009 Sep 14;10:431. doi: 10.1186/1471-2164-10-431. BMC Genomics. 2009. PMID: 19751524 Free PMC article. - Mechanisms of regulation of mature miRNAs.
Towler BP, Jones CI, Newbury SF. Towler BP, et al. Biochem Soc Trans. 2015 Dec;43(6):1208-14. doi: 10.1042/BST20150157. Biochem Soc Trans. 2015. PMID: 26614662 Review. - The complexities of microRNA regulation: mirandering around the rules.
Breving K, Esquela-Kerscher A. Breving K, et al. Int J Biochem Cell Biol. 2010 Aug;42(8):1316-29. doi: 10.1016/j.biocel.2009.09.016. Epub 2009 Sep 30. Int J Biochem Cell Biol. 2010. PMID: 19800023 Review.
Cited by
- Targeted deletion of miR-132/-212 impairs memory and alters the hippocampal transcriptome.
Hansen KF, Sakamoto K, Aten S, Price KH, Loeser J, Hesse AM, Page CE, Pelz C, Arthur JS, Impey S, Obrietan K. Hansen KF, et al. Learn Mem. 2016 Jan 15;23(2):61-71. doi: 10.1101/lm.039578.115. Print 2016 Feb. Learn Mem. 2016. PMID: 26773099 Free PMC article. - MicroRNA-182 regulates amygdala-dependent memory formation.
Griggs EM, Young EJ, Rumbaugh G, Miller CA. Griggs EM, et al. J Neurosci. 2013 Jan 23;33(4):1734-40. doi: 10.1523/JNEUROSCI.2873-12.2013. J Neurosci. 2013. PMID: 23345246 Free PMC article. - Neuronal activity regulates DROSHA via autophagy in spinal muscular atrophy.
Gonçalves IDCG, Brecht J, Thelen MP, Rehorst WA, Peters M, Lee HJ, Motameny S, Torres-Benito L, Ebrahimi-Fakhari D, Kononenko NL, Altmüller J, Vilchez D, Sahin M, Wirth B, Kye MJ. Gonçalves IDCG, et al. Sci Rep. 2018 May 21;8(1):7907. doi: 10.1038/s41598-018-26347-y. Sci Rep. 2018. PMID: 29784949 Free PMC article. - Physical exercise as an epigenetic modulator of brain plasticity and cognition.
Fernandes J, Arida RM, Gomez-Pinilla F. Fernandes J, et al. Neurosci Biobehav Rev. 2017 Sep;80:443-456. doi: 10.1016/j.neubiorev.2017.06.012. Epub 2017 Jun 27. Neurosci Biobehav Rev. 2017. PMID: 28666827 Free PMC article. Review. - Noradrenergic activation of the basolateral amygdala enhances object recognition memory and induces chromatin remodeling in the insular cortex.
Beldjoud H, Barsegyan A, Roozendaal B. Beldjoud H, et al. Front Behav Neurosci. 2015 Apr 28;9:108. doi: 10.3389/fnbeh.2015.00108. eCollection 2015. Front Behav Neurosci. 2015. PMID: 25972794 Free PMC article.
References
- Sutton MA, Schuman EM. Dendritic protein synthesis, synaptic plasticity, and memory. Cell. 2006;127:49–58. - PubMed
- Bartel DP. MicroRNAs: genomics, biogenesis, mechanism, and function. Cell. 2004;116:281–297. - PubMed
- Filipowicz W, Bhattacharyya SN, Sonenberg N. Mechanisms of post-transcriptional regulation by microRNAs: are the answers in sight? Nat Rev Genet. 2008;9:102–114. - PubMed
Publication types
MeSH terms
Substances
LinkOut - more resources
Full Text Sources
Other Literature Sources
Miscellaneous


