Multivesicular bodies mature from the trans-Golgi network/early endosome in Arabidopsis - PubMed (original) (raw)
Multivesicular bodies mature from the trans-Golgi network/early endosome in Arabidopsis
David Scheuring et al. Plant Cell. 2011 Sep.
Abstract
The plant trans-Golgi network/early endosome (TGN/EE) is a major hub for secretory and endocytic trafficking with complex molecular mechanisms controlling sorting and transport of cargo. Vacuolar transport from the TGN/EE to multivesicular bodies/late endosomes (MVBs/LEs) is assumed to occur via clathrin-coated vesicles, although direct proof for their participation is missing. Here, we present evidence that post-TGN transport toward lytic vacuoles occurs independently of clathrin and that MVBs/LEs are derived from the TGN/EE through maturation. We show that the V-ATPase inhibitor concanamycin A significantly reduces the number of MVBs and causes TGN and MVB markers to colocalize in Arabidopsis thaliana roots. Ultrastructural analysis reveals the formation of MVBs from the TGN/EE and their fusion with the vacuole. The localization of the ESCRT components VPS28, VPS22, and VPS2 at the TGN/EE and MVBs/LEs indicates that the formation of intraluminal vesicles starts already at the TGN/EE. Accordingly, a dominant-negative mutant of VPS2 causes TGN and MVB markers to colocalize and blocks vacuolar transport. RNA interference-mediated knockdown of the annexin ANNAT3 also yields the same phenotype. Together, these data indicate that MVBs originate from the TGN/EE in a process that requires the action of ESCRT for the formation of intraluminal vesicles and annexins for the final step of releasing MVBs as a transport carrier to the vacuole.
Figures
Figure 1.
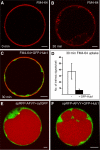
Clathrin-Hub1 Expression Inhibits Endocytosis but Not Vacuolar Transport in Arabidopsis Protoplasts. (A) and (B) Staining of the PM directly after FM4-64 addition (A) and endocytic uptake of the dye after 30 min incubation (B). (C) Protoplasts expressing the GFP-tagged clathrin-Hub1 (GFP-Hub1) were stained with FM4-64 and incubated for 30 min. The dye is not internalized and remains at the PM. (D) Comparative quantification of intrinsic FM4-64 signals from 20 protoplasts either in the presence or absence of GFP-Hub1. Error bars indicate the
sd
of signal numbers. (E) Coexpression of the soluble vacuolar marker spRFP-AFVY and cytosolic GFP (cytGFP) in protoplasts. spRFP-AFVY is efficiently transported into the lumen of the vacuole, even if fluorescent cytosolic proteins (cytGFP) are coexpressed. (F) Coexpression of GFP-Hub1 and the soluble vacuolar marker spRFP-AFVY in protoplasts. The presence of GFP-Hub1 in the cytosol does not perturb vacuolar transport of spRFP-AFVY (cf. to [E]). Bars = 5 μm.
Figure 2.
EM Analysis of the Effects of ConcA on MVBs. (A) ConcA treatment reduces the number of MVBs in the cell. Roots of four independent plants were analyzed either in the absence or presence of ConcA by counting the number of MVBs in 100 sectioned cells per root. Per 100 control cells, 220 ± 30 MVBs were identified, whereas after ConcA treatment, the number of MVBs was fivefold lower (40 ± 15). Error bars indicate the
sd
. (B) Quantitative analysis of ConcA effects on the endogenous VSR BP80 and the Rab GTPase ARA7 in an mRFP-ARA7–expressing Arabidopsis line. The Golgi localization of BP80 and mRFP-ARA7 was analyzed in roots of four independent plants either in the absence or presence of ConcA by counting the labeling on 50 randomly chosen Golgi stacks per root. Under standard conditions, BP80 and mRFP-ARA7 do not localize to the Golgi (11% ± 4% and 15% ± 2% of Golgi labeling, respectively), whereas in the presence of ConcA, both proteins also significantly localize to the Golgi stacks (59% ± 5% and 58% ± 4% of Golgi labeling, respectively). Error bars indicate the
sd
. (C) IEM localization of the endogenous BP80 in Arabidopsis roots after high-pressure freezing, freeze substitution and Lowicryl HM20 resin embedding. The VSR BP80 localizes to both the TGN (closed arrowheads) and MVBs (open arrowheads). (D) and (E) Upon ConcA treatment, BP80 is detected at the Golgi stack ([D]; arrows) and at enlarged vesicles in the surrounding area ([E]; closed arrowheads). Although ConcA reduces the number of MVBs, those MVBs that are still present show unaltered BP80 labeling ([E]; open arrowheads). (F) The Rab GTPase mRFP-ARA7 localizes to the limiting membrane of MVBs (arrowheads). (G) After ConcA treatment, mRFP-ARA7 localizes to both swollen vesicles (arrowheads) and the Golgi stack (arrows). (H) In the presence of ConcA, mRFP-ARA7 is detected at the limiting membrane of the remaining MVBs (open arrowheads). Bars = 200 nm
Figure 3.
MVBs Fuse with the Vacuole. Fusion of MVBs with the vacuole in sections of cells from high-pressure frozen Arabidopsis roots. V, vacuole; Bars = 200 nm (A) and (B) The limiting membrane of an MVB (arrow) has fused with the tonoplast, resulting in the merge of the lumen of both compartments. In (B), internal vesicles are recognizable in the lumen of the vacuole (arrowheads), sharing shape and size with ILVs, typically seen in MVBs (courtesy of York-Dieter Stierhof). (C) An MVB (arrow) almost entirely fused with a small vacuole. (D) An MVB (arrow), entirely fused with a small vacuole, shows a polarized distribution of the inner vesicles, suggesting that the fusion occurred shortly before freezing of the cells. Note that there is another MVB in the vicinity (arrowhead).
Figure 4.
MVBs Mature from Tubular-Vesicular Structures. (A) and (B) Mature MVBs in sections from high-pressure frozen untreated (untr) root cells typically have an almost perfect circular profile. Depending upon the plane of section, a plaque (arrow in [B]) is occasionally visible. (C) An MVB (arrow) attached to a tubular-vesicular structure (arrowhead) in untreated Arabidopsis root tip cells. (D) An MVB showing a tubular connection (arrow) and bottleneck terminations (arrowheads) in untreated Arabidopsis root tip cells. (E) to (H) MVBs seen in Arabidopsis root tip cells during recovery from ConcA treatment (45 min ConcA; followed by 15-min washout) are pleiomorphic, often with bottleneck terminations. In (E) and (F), MVBs (arrows) are attached to tubular structures (arrowheads) in the area of the TGN; in (G) and (H), pleiomorphic MVBs display bottleneck terminations (arrowheads), indicating a possible connection to tubular structures above or beneath the plane of section. (I) and (J) MVBs (arrows) directly connected to TGN-like structures (arrowheads). In (J), root-tip cells were chemically fixed. (K) mRFP-ARA7 localization at the limiting membrane of these unusually shaped (compared with [A] and [B]) multivesiculated structures confirms their identity as MVBs. G, Golgi. Bars = 200 nm.
Figure 5.
The ESCRT-I Component VPS28 Localizes to the Golgi and the TGN. (A) Immunodetection of VPS28 in total protein extracts from 7-d-old Arabidopsis plants (left) using antibodies against VPS28 (αVPS28) and VPS28-GFP transiently expressed in protoplasts isolated from Arabidopsis suspension cultures (middle and right). Protoplasts were transfected with 3, 10, 30, or 100 μg plasmid DNA encoding for VPS28-GFP or mock transfected (−). Total protein extracts from protoplasts were probed with antibodies against VPS28 (αVPS28) and antibodies against GFP (αGFP). (B) IEM analysis using the αVPS28 antibodies on high-pressure frozen Arabidopsis wild-type root cells shows that the endogenous VPS28 localizes to the Golgi stacks and the TGN (arrows). (C) IEM of the endogenous VPS28 shows that VPS28 localizes to the Golgi stack and the TGN (arrows) but is not detected on the MVB (D) Quantitative analysis of VPS28 IEM. The labeling density, expressed as the number of gold particles per micrometer2 (gold/μm2), is significantly higher for the TGN and the Golgi apparatus (18.8 and 11.1 gold/μm2, respectively) compared to the MVBs (3.1 gold/μm2) or plastids/mitocondria (1.4 gold/μm2). N°, number of compartments encountered; N° lab., number of compartments labeled; μm2, total area considered; gold, total number of gold particles detected; gold/μm2, labeling density. (E) Double immunolocalization of VPS28 in an Arabidopsis line expressing the TGN marker SYP61-CFP under the control of the endogenous promoter, using the polyclonal αVPS28 antibodies from rabbit in combination with 15-nm (arrowheads) gold-coupled secondary antibodies and monoclonal αGFP antibodies from mouse in combination with 5-nm (arrows) gold-coupled secondary antibodies. Both, the TGN marker and VPS28 localize to the same tubular-vesicular structure, immediately adjacent to the Golgi stacks. (F) In BFA-treated Arabidopsis plants, VPS28 labels the core of the BFA compartment, confirming TGN localization of this ESCRT-I subunit. G, Golgi; T, TGN; M, MVB/LE; B, BFA compartment. Bars = 200 nm.
Figure 6.
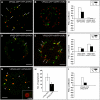
Gradual Distribution of the ESCRT-II Component VPS22 and the ESCRT-III Component VPS2. Tobacco mesophyll protoplasts were transfected with plasmids encoding fluorescent markers/reporters as indicated below. Proteins were expressed for 18 to 24 h prior to CLSM analysis. White arrows indicate colocalization. For quantification, the PSC coefficients (_r_p and _r_s) were calculated after analysis of at least 10 individual protoplasts and a minimum of 200 signals. The level of colocalization ranges from +1 for perfect correlation to −1 for negative correlation. For the corresponding scatterplots of the fluorescence values of pixels across the two channels, see
Supplemental Figure 2
online. (A) Coexpression of VPS22-GFP and the TGN/EE marker YFP-SYP61. (B) VPS22-GFP was coexpressed with the MVB/LE marker mRFP-VSR2. (C) Quantification of VPS22-GFP colocalization with TGN/EE (YFP-SYP61) and MVB/LE (mRFP-VSR2) marker. (D) Coexpression of VPS2-GFP and YFP-SYP61. (E) VPS2-GFP and mRFP-VSR2 were coexpressed. (F) Quantification of VPS2-GFP colocalization with TGN/EE and MVB/LE marker. (G) Coexpression of VPS22-GFP and VPS2-RFP. Some VPS2-RFP signals do not colocalize (white arrowheads). Only VPS2-RFP signals localize to WM-sensitive compartments, as indicated by the magnified ring-like structure. (H) Quantitative comparison of the number of VPS2-RFP and VPS22-GFP signals. Error bars indicate the
sd
of numbers of signals. (I) Quantification of VPS22-GFP and VPS2-RFP colocalization. Bars = 5 μm.
Figure 7.
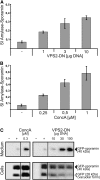
Effects of ConcA and the ESCRT-III Mutant VPS2-DN on Vacuolar Transport. Tobacco mesophyll protoplasts were transfected with plasmids encoding for reporters/effectors, as indicated below. Proteins were expressed for 18 to 24 h prior to analysis. For analyzing vacuolar transport, the α-amylase derivative amylase-sporamin (amy-spo) was used. The SI is calculated as the ratio of the activity of amy-spo secreted to the culture medium and the activity of amy-spo within the cells. (A) VPS2-DN causes a dosage-dependent mis-sorting of the vacuolar reporter amy-spo and subsequent secretion into the culture medium. Error bars indicate
sd
of five individual experiments. (B) Treatment with increasing concentrations of ConcA leads to the same effect than described in (A) but stronger (10-fold increase of the SI). Error bars indicate
sd
of five individual experiments. (C) Immunoblot analysis of protein transport after transient expression of the soluble vacuolar reporter GFP-sporamin in the presence of ConcA (left panel) or coexpression with VPS2-DN (right panel) using GFP-antibodies for immunodetection of the reporter. −, Mock transfection; +, positive control of GFP-sporamin expression without effector.
Figure 8.
VPS2-DN Causes Marker Proteins for TGN/EE and MVB/LE to Colocalize. Tobacco mesophyll protoplasts were transfected with plasmids encoding for fluorescent markers/reporters as indicated below. Proteins were expressed for 18 h prior to CLSM analysis. For quantification, the PSC coefficients (_r_p and _r_s) were calculated after analysis of at least 10 individual protoplasts and a minimum of 200 signals. The level of colocalization ranges from +1 for perfect correlation to −1 for negative correlation. For the corresponding scatterplots of the fluorescence values of pixels across the two channels, see
Supplemental Figure 5
online. (A) Coexpression of TGN/EE and MVB/LE markers YFP-SYP61 and mRFP-VSR2 18 h after transfection. (B) Effect of VPS2-DN on the distribution of TGN/EE and MVB/LE markers 14 h after transfection. (C) Analysis 18 h after transfection: VPS2-DN causes a change in the signal pattern of the marker proteins. The signals accumulate in bigger but fewer structures. (D) Quantification of the marker colocalization. The _r_p and _r_s values increase when VPS2-DN is expressed. (E) Coexpression of TGN/EE and MVB/LE markers YFP-SYP61 and mRFP-ARA7 18 h after transfection. (F) Effect of the VPS2-DN coexpression with YFP-SYP61 and mRFP-ARA7 14 h after transfection. (G) When expressed for 18 h, VPS2-DN increases colocalization of YFP-SYP61 and mRFP-ARA7. As observed in (C), the signals change structurally. (H) Quantification reveals higher _r_p and _r_s values for the marker proteins when VPS2-DN is expressed. (I) to (L) An experiment as described in (E) to (H) was performed, except ARA6-mRFP was used as MVB/LE marker. Here, the highest increase of _r_p and _r_s values is found (L). Bars = 5 μm.
Figure 9.
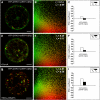
RNAi Knockdown of the Annexin ANNAT3 Increases Colocalization of TGN/EE and MVB/LE Marker Proteins. Tobacco mesophyll protoplasts were transfected with plasmids encoding for fluorescent markers/reporters as indicated below. Proteins were expressed for 18 to 24 h prior to CLSM analysis. For quantification, the PSC coefficients (_r_p and _r_s) were calculated after analysis of at least 10 individual protoplasts and a minimum of 200 signals. The level of colocalization ranges from +1 for positive correlation to −1 for negative correlation, and the fluorescence values of pixels across the two channels are depicted in an intensity scatterplot. (A) Tobacco protoplast expressing YFP-SYP61 as TGN/EE marker and mRFP-VSR2 as MVB/LE marker. (B) Intensities of fluorescent signals from (A), representing YFP-SYP61 (green) and mRFP-VSR2 (red), are depicted in a scatterplot. The calculated PSC values are given in the top right corner. (C) Bar chart to illustrate the PSC coefficients from (B). (D) Protoplasts from (A) were incubated for 1 h in the presence of 1 μM ConcA. (E) Intensities of fluorescent signals from (D), representing YFP-SYP61 (green) and mRFP-VSR2 (red), are depicted in a scatterplot. The calculated PSC values are given in the top right corner. (F) Bar chart to illustrate the PSC coefficients from (E). (G) RNAi-based knockdown of ANNAT3 by cotransfection of plasmid DNA encoding for RNAi-ANNAT3 and the markers YFP-SYP61 and mRFP-VSR2. (H) Intensities of fluorescent signals from (G), representing YFP-SYP61 (green) and mRFP-VSR2 (red), are depicted in a scatterplot. The calculated PSC values are given in the top right corner. The _r_p and _r_s values are considerably higher compared with the control (B). (I) Bar chart to illustrate the PSC coefficients from (H). Bars = 5 μm.
Figure 10.
Model Illustrating MVB Maturation from the TGN. According to this model, the TGN is continually formed and released from the Golgi stack. It also functions as an EE and receives incoming cargo from the PM via CCVs. As it differentiates, the TGN probably subdivides into domains where SVs are released to the PM, into domains releasing CCVs for recycling to the PM (recycling endosomes) and into a domain that matures into an MVB. Participating in the latter process, as indicated, are the ESCRT complexes I, II, and III, as well as annexin. As in mammalian cells, we postulate that post-TGN trafficking of soluble proteins to the lytic compartment (vacuole) occurs receptor independently and is accompanied by a gradual transformation of parts of the EE (TGN) into the LE (MVB), which ultimately fuses with the vacuole membrane.
Similar articles
- Receptor-mediated sorting of soluble vacuolar proteins: myths, facts, and a new model.
Robinson DG, Neuhaus JM. Robinson DG, et al. J Exp Bot. 2016 Aug;67(15):4435-49. doi: 10.1093/jxb/erw222. Epub 2016 Jun 4. J Exp Bot. 2016. PMID: 27262127 Review. - Receptor-mediated sorting of soluble vacuolar proteins ends at the trans-Golgi network/early endosome.
Künzl F, Früholz S, Fäßler F, Li B, Pimpl P. Künzl F, et al. Nat Plants. 2016 Mar 7;2:16017. doi: 10.1038/nplants.2016.17. Nat Plants. 2016. PMID: 27249560 - Ubiquitin initiates sorting of Golgi and plasma membrane proteins into the vacuolar degradation pathway.
Scheuring D, Künzl F, Viotti C, Yan MS, Jiang L, Schellmann S, Robinson DG, Pimpl P. Scheuring D, et al. BMC Plant Biol. 2012 Sep 12;12:164. doi: 10.1186/1471-2229-12-164. BMC Plant Biol. 2012. PMID: 22970698 Free PMC article. - Endocytic and secretory traffic in Arabidopsis merge in the trans-Golgi network/early endosome, an independent and highly dynamic organelle.
Viotti C, Bubeck J, Stierhof YD, Krebs M, Langhans M, van den Berg W, van Dongen W, Richter S, Geldner N, Takano J, Jürgens G, de Vries SC, Robinson DG, Schumacher K. Viotti C, et al. Plant Cell. 2010 Apr;22(4):1344-57. doi: 10.1105/tpc.109.072637. Epub 2010 Apr 30. Plant Cell. 2010. PMID: 20435907 Free PMC article. - Plant endosomal trafficking pathways.
Reyes FC, Buono R, Otegui MS. Reyes FC, et al. Curr Opin Plant Biol. 2011 Dec;14(6):666-73. doi: 10.1016/j.pbi.2011.07.009. Epub 2011 Aug 5. Curr Opin Plant Biol. 2011. PMID: 21821464 Review.
Cited by
- Subcellular Localization of Acyl-CoA: Lysophosphatidylethanolamine Acyltransferases (LPEATs) and the Effects of Knocking-Out and Overexpression of Their Genes on Autophagy Markers Level and Life Span of A. thaliana.
Jasieniecka-Gazarkiewicz K, Demski K, Gidda SK, Klińska S, Niedojadło J, Lager I, Carlsson AS, Minina EA, Mullen RT, Bozhkov PV, Stymne S, Banaś A. Jasieniecka-Gazarkiewicz K, et al. Int J Mol Sci. 2021 Mar 16;22(6):3006. doi: 10.3390/ijms22063006. Int J Mol Sci. 2021. PMID: 33809440 Free PMC article. - Nonselective Chemical Inhibition of Sec7 Domain-Containing ARF GTPase Exchange Factors.
Mishev K, Lu Q, Denoo B, Peurois F, Dejonghe W, Hullaert J, De Rycke R, Boeren S, Bretou M, De Munck S, Sharma I, Goodman K, Kalinowska K, Storme V, Nguyen LSL, Drozdzecki A, Martins S, Nerinckx W, Audenaert D, Vert G, Madder A, Otegui MS, Isono E, Savvides SN, Annaert W, De Vries S, Cherfils J, Winne J, Russinova E. Mishev K, et al. Plant Cell. 2018 Oct;30(10):2573-2593. doi: 10.1105/tpc.18.00145. Epub 2018 Jul 17. Plant Cell. 2018. PMID: 30018157 Free PMC article. - TGNap1 is required for microtubule-dependent homeostasis of a subpopulation of the plant trans-Golgi network.
Renna L, Stefano G, Slabaugh E, Wormsbaecher C, Sulpizio A, Zienkiewicz K, Brandizzi F. Renna L, et al. Nat Commun. 2018 Dec 14;9(1):5313. doi: 10.1038/s41467-018-07662-4. Nat Commun. 2018. PMID: 30552321 Free PMC article. - The Arabidopsis receptor kinase STRUBBELIG undergoes clathrin-dependent endocytosis.
Gao J, Chaudhary A, Vaddepalli P, Nagel MK, Isono E, Schneitz K. Gao J, et al. J Exp Bot. 2019 Aug 7;70(15):3881-3894. doi: 10.1093/jxb/erz190. J Exp Bot. 2019. PMID: 31107531 Free PMC article. - Arabidopsis ECHIDNA protein is involved in seed coloration, protein trafficking to vacuoles, and vacuolar biogenesis.
Ichino T, Maeda K, Hara-Nishimura I, Shimada T. Ichino T, et al. J Exp Bot. 2020 Jul 6;71(14):3999-4009. doi: 10.1093/jxb/eraa147. J Exp Bot. 2020. PMID: 32201898 Free PMC article.
References
- Abramoff M.D., Magelhaes P.J., Ram S.J. (2004). Image processing with ImageJ. Biophotonics International 11: 36–42
- Aniento F., Papavassiliou A.G., Knecht E., Roche E. (1996). Selective uptake and degradation of c-Fos and v-Fos by rat liver lysosomes. FEBS Lett. 390: 47–52 - PubMed
- Babst M., Katzmann D.J., Estepa-Sabal E.J., Meerloo T., Emr S.D. (2002a). Escrt-III: An endosome-associated heterooligomeric protein complex required for mvb sorting. Dev. Cell 3: 271–282 - PubMed
- Babst M., Katzmann D.J., Snyder W.B., Wendland B., Emr S.D. (2002b). Endosome-associated complex, ESCRT-II, recruits transport machinery for protein sorting at the multivesicular body. Dev. Cell 3: 283–289 - PubMed
- Bilodeau P.S., Urbanowski J.L., Winistorfer S.C., Piper R.C. (2002). The Vps27p Hse1p complex binds ubiquitin and mediates endosomal protein sorting. Nat. Cell Biol. 4: 534–539 - PubMed
Publication types
MeSH terms
Substances
LinkOut - more resources
Full Text Sources
Other Literature Sources
Molecular Biology Databases
Miscellaneous


