Phased whole-genome genetic risk in a family quartet using a major allele reference sequence - PubMed (original) (raw)
. 2011 Sep;7(9):e1002280.
doi: 10.1371/journal.pgen.1002280. Epub 2011 Sep 15.
Rong Chen, Sergio P Cordero, Kelly E Ormond, Colleen Caleshu, Konrad J Karczewski, Michelle Whirl-Carrillo, Matthew T Wheeler, Joel T Dudley, Jake K Byrnes, Omar E Cornejo, Joshua W Knowles, Mark Woon, Katrin Sangkuhl, Li Gong, Caroline F Thorn, Joan M Hebert, Emidio Capriotti, Sean P David, Aleksandra Pavlovic, Anne West, Joseph V Thakuria, Madeleine P Ball, Alexander W Zaranek, Heidi L Rehm, George M Church, John S West, Carlos D Bustamante, Michael Snyder, Russ B Altman, Teri E Klein, Atul J Butte, Euan A Ashley
Affiliations
- PMID: 21935354
- PMCID: PMC3174201
- DOI: 10.1371/journal.pgen.1002280
Phased whole-genome genetic risk in a family quartet using a major allele reference sequence
Frederick E Dewey et al. PLoS Genet. 2011 Sep.
Abstract
Whole-genome sequencing harbors unprecedented potential for characterization of individual and family genetic variation. Here, we develop a novel synthetic human reference sequence that is ethnically concordant and use it for the analysis of genomes from a nuclear family with history of familial thrombophilia. We demonstrate that the use of the major allele reference sequence results in improved genotype accuracy for disease-associated variant loci. We infer recombination sites to the lowest median resolution demonstrated to date (< 1,000 base pairs). We use family inheritance state analysis to control sequencing error and inform family-wide haplotype phasing, allowing quantification of genome-wide compound heterozygosity. We develop a sequence-based methodology for Human Leukocyte Antigen typing that contributes to disease risk prediction. Finally, we advance methods for analysis of disease and pharmacogenomic risk across the coding and non-coding genome that incorporate phased variant data. We show these methods are capable of identifying multigenic risk for inherited thrombophilia and informing the appropriate pharmacological therapy. These ethnicity-specific, family-based approaches to interpretation of genetic variation are emblematic of the next generation of genetic risk assessment using whole-genome sequencing.
Conflict of interest statement
JVT and AWZ are founders, consultants, and equity holders in Clinical Future; GMC has advisory roles in and research sponsorships from several companies involved in genome sequencing technology and personal genomics (see http://arep.med.harvard.edu/gmc/tech.html); MS is on the scientific advisory board of DNA Nexus and holds stock in Personalis; RBA has received consultancy fees from Novartis and 23andMe and holds stock in Personalis; AJB is a scientific advisory board member and founder for NuMedii and Genstruct, a scientific advisory board member for Johnson and Johnson, has received consultancy fees from Lilly, NuMedii, Johnson and Johnson, Genstruct, Tercica, and Prevendia and honoraria from Lilly and Siemens, and holds stock in NuMedii, Genstruct, and Personalis. EAA holds stock in Personalis.
Figures
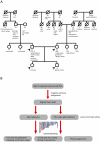
Figure 1. Pedigree and genetic risk prediction workflow.
A, Family pedigree with known medical history. The displayed ages represent the age of death for deceased subjects or the age at the time of medical history collection (9/2010) for living family members. Arrows denote sequenced family members. Abbreviations: AD, Alzheimer's disease; CABG, coronary artery bypass graft surgery; CHF, congestive heart failure; CVA, cerebrovascular accident; DM, diabetes mellitus; DVT, deep venous thrombosis; GERD, gastroesophageal reflux disease; HTN, hypertension; IDDM, insulin-dependent diabetes mellitus; MI, myocardial infarction; SAB, spontaneous abortion; SCD, sudden cardiac death. B, Workflow for phased genetic risk evaluation using whole genome sequencing.
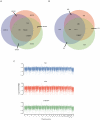
Figure 2. Development of major allele reference sequences.
Allele frequencies from the low coverage whole genome sequencing pilot of the 1000 genomes data were used to estimate the major allele for each of the three main HapMap populations. The major allele was substituted for the NCBI reference sequence 37.1 reference base at every position at which the reference base differed from the major allele, resulting in approximately 1.6 million single nucleotide substitutions in the reference sequence. A, Approximately half of these positions were shared between all three HapMap population groups, with the YRI population containing the greatest number of major alleles differing from the NCBI reference sequence. B, Number of disease-associated variants represented in the NCBI reference genome by the minor allele in each of the three HapMap populations. C, Number of positions per Mbp at which the major allele differed from the reference base by chromosome and HapMap population.
Figure 3. Inheritance state analysis, error estimation, and phasing.
A, A Hidden Markov Model (HMM) was used to infer one of four Mendelian and two non-Mendelian inheritance states for each allele assortment at variant positions across the quartet. “MIE-rich” refers to Mendelian-inheritance error (MIE) rich regions. “Compression” refers to genotype errors from heterozygous structural variation in the reference or study subjects, manifest as a high proportion of uniformly heterozygous positions across the quartet. B, A combination of quality score calibration using orthogonal genotyping technology and filtering SNVs in error prone regions (MIE-rich and compression regions) identified by the HMM resulted in >90% reduction in the genotype error rate estimated by the MIE rate. C, Consistent with PRDM9 allelic status, approximately half of all recombinations in each parent occurred in hotspots. The mother has two haplotypes in the gene RNF212 associated with low recombination rates, while the father has one haplotype each associated with high and low recombination rates. Notation denotes base at [rs3796619, rs1670533]. D, Variant phasing using pedigree, inheritance state, and population linkage disequilibrium data. Pedigree data were first used to phase informative allele assortments in trios (top). The inheritance state of neighboring regions was used to phase positions in which all members of a mother-father-child trio were heterozygous and the sibling was homozygous for the reference or non-reference allele (middle). For uniformly heterozygous positions, we phased the non-reference allele using a maximum likelihood model to assign the non-reference allele to paternal or maternal chromosomes based on population linkage disequilibrium with phased SNVs within 250 kbp (bottom). In all panels a corresponds to the reference allele and b to the non-reference allele.
Figure 4. Ancestry and immunogenotyping using phased variant data.
A, Ancestry analysis of maternal and paternal origins based on principle components analysis of SNP genotypes intersected with the Population Reference Sample dataset. B, The HMM identified a recombination spanning the HLA–B locus and facilitated resolution of haplotype phase at HLA loci. Contig colors in the lower panel correspond to the inheritance state as depicted in Figure 3A. C, Common HLA types for family quartet based on phased sequence data.
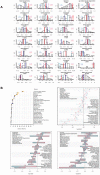
Figure 5. Common variant risk prediction.
A, Common variant risk prediction for 28 disease states for each of the family members (f, father; m, mother; s, son; d, daughter) and 174 ethnicity-matched HapMap subjects. The x-axis in each plot represents the log10(likelihood ratio) for each disease according to allelic distribution of SNPs identified in the literature as significantly associated with disease by 2 or more studies including 2000 or more total subjects. B, Upper left: pre (base) and post (bar end) estimates of disease risk for the father according to common variant risk prediction, derived from the pre-probability of disease multiplied by the composite likelihood ratio from all SNPs meeting the criteria described above. Upper right: Composite likelihood ratio estimates for disease risk according to common genetic variation. Blue bars represent paternal estimate, pink bars represent maternal estimate, red points represent the estimate for the daughter, and blue points represent the estimate for the son. Lower panels: parental haplotype contribution to disease risk for each child (points) for the daughter (lower left) and son (lower right). Blue shading represents paternal haplotype risk allele contribution and pink shading represents maternal haplotype risk allele contribution.
Comment in
- Genomics: Getting personal and regional.
Burgess DJ. Burgess DJ. Nat Rev Genet. 2011 Oct 4;12(11):744. doi: 10.1038/nrg3087. Nat Rev Genet. 2011. PMID: 21969036 No abstract available.
Similar articles
- Complete genome phasing of family quartet by combination of genetic, physical and population-based phasing analysis.
Lajugie J, Mukhopadhyay R, Schizas M, Lailler N, Fourel N, Bouhassira EE. Lajugie J, et al. PLoS One. 2013 May 31;8(5):e64571. doi: 10.1371/journal.pone.0064571. Print 2013. PLoS One. 2013. PMID: 23741343 Free PMC article. - A map of human genome variation from population-scale sequencing.
1000 Genomes Project Consortium; Abecasis GR, Altshuler D, Auton A, Brooks LD, Durbin RM, Gibbs RA, Hurles ME, McVean GA. 1000 Genomes Project Consortium, et al. Nature. 2010 Oct 28;467(7319):1061-73. doi: 10.1038/nature09534. Nature. 2010. PMID: 20981092 Free PMC article. - An efficient study design to test parent-of-origin effects in family trios.
Yu X, Chen G, Feng R. Yu X, et al. Genet Epidemiol. 2017 Nov;41(7):587-598. doi: 10.1002/gepi.22060. Epub 2017 Jul 20. Genet Epidemiol. 2017. PMID: 28726280 Free PMC article. - What will diabetes genomes tell us?
Mohlke KL, Scott LJ. Mohlke KL, et al. Curr Diab Rep. 2012 Dec;12(6):643-50. doi: 10.1007/s11892-012-0321-4. Curr Diab Rep. 2012. PMID: 22983892 Free PMC article. Review. - Genetic predisposition for multiple myeloma.
Pertesi M, Went M, Hansson M, Hemminki K, Houlston RS, Nilsson B. Pertesi M, et al. Leukemia. 2020 Mar;34(3):697-708. doi: 10.1038/s41375-019-0703-6. Epub 2020 Jan 8. Leukemia. 2020. PMID: 31913320 Review.
Cited by
- Promise of personalized omics to precision medicine.
Chen R, Snyder M. Chen R, et al. Wiley Interdiscip Rev Syst Biol Med. 2013 Jan-Feb;5(1):73-82. doi: 10.1002/wsbm.1198. Epub 2012 Nov 26. Wiley Interdiscip Rev Syst Biol Med. 2013. PMID: 23184638 Free PMC article. Review. - De novo pathogenic SCN8A mutation identified by whole-genome sequencing of a family quartet affected by infantile epileptic encephalopathy and SUDEP.
Veeramah KR, O'Brien JE, Meisler MH, Cheng X, Dib-Hajj SD, Waxman SG, Talwar D, Girirajan S, Eichler EE, Restifo LL, Erickson RP, Hammer MF. Veeramah KR, et al. Am J Hum Genet. 2012 Mar 9;90(3):502-10. doi: 10.1016/j.ajhg.2012.01.006. Epub 2012 Feb 23. Am J Hum Genet. 2012. PMID: 22365152 Free PMC article. - In depth comparison of an individual's DNA and its lymphoblastoid cell line using whole genome sequencing.
Nickles D, Madireddy L, Yang S, Khankhanian P, Lincoln S, Hauser SL, Oksenberg JR, Baranzini SE. Nickles D, et al. BMC Genomics. 2012 Sep 14;13:477. doi: 10.1186/1471-2164-13-477. BMC Genomics. 2012. PMID: 22974163 Free PMC article. - Exploring predisposition and treatment response--the promise of genomics.
Pan S, Knowles JW. Pan S, et al. Prog Cardiovasc Dis. 2012 Jul-Aug;55(1):56-63. doi: 10.1016/j.pcad.2012.04.006. Prog Cardiovasc Dis. 2012. PMID: 22824110 Free PMC article. Review. - From genetic counseling to "genomic counseling".
Ormond KE. Ormond KE. Mol Genet Genomic Med. 2013 Nov;1(4):189-93. doi: 10.1002/mgg3.45. Mol Genet Genomic Med. 2013. PMID: 24498615 Free PMC article. No abstract available.
References
Publication types
MeSH terms
Grants and funding
- OD004613/OD/NIH HHS/United States
- 5 P50 HG003389-05/HG/NHGRI NIH HHS/United States
- R01 HG003229/HG/NHGRI NIH HHS/United States
- U01HG005715/HG/NHGRI NIH HHS/United States
- U01 HG005715/HG/NHGRI NIH HHS/United States
- U01 GM061374/GM/NIGMS NIH HHS/United States
- T32 HL094274/HL/NHLBI NIH HHS/United States
- R01 GM079719/GM/NIGMS NIH HHS/United States
- U01 GM61374/GM/NIGMS NIH HHS/United States
- T32 HL094274-01A2/HL/NHLBI NIH HHS/United States
- K08 HL083914/HL/NHLBI NIH HHS/United States
- T15 LM007033/LM/NLM NIH HHS/United States
- F32 HL097462/HL/NHLBI NIH HHS/United States
- P50 HG003389/HG/NHGRI NIH HHS/United States


