Performance comparison of exome DNA sequencing technologies - PubMed (original) (raw)
Comparative Study
. 2011 Sep 25;29(10):908-14.
doi: 10.1038/nbt.1975.
Affiliations
- PMID: 21947028
- PMCID: PMC4127531
- DOI: 10.1038/nbt.1975
Comparative Study
Performance comparison of exome DNA sequencing technologies
Michael J Clark et al. Nat Biotechnol. 2011.
Abstract
Whole exome sequencing by high-throughput sequencing of target-enriched genomic DNA (exome-seq) has become common in basic and translational research as a means of interrogating the interpretable part of the human genome at relatively low cost. We present a comparison of three major commercial exome sequencing platforms from Agilent, Illumina and Nimblegen applied to the same human blood sample. Our results suggest that the Nimblegen platform, which is the only one to use high-density overlapping baits, covers fewer genomic regions than the other platforms but requires the least amount of sequencing to sensitively detect small variants. Agilent and Illumina are able to detect a greater total number of variants with additional sequencing. Illumina captures untranslated regions, which are not targeted by the Nimblegen and Agilent platforms. We also compare exome sequencing and whole genome sequencing (WGS) of the same sample, demonstrating that exome sequencing can detect additional small variants missed by WGS.
Figures
Figure 1
Exome enrichment designs include different biochemical methods, bait lengths, quantity and overlap of baits and number of bases targeted. (a) Bait design details for each commercial platform are represented in this ideogram and accompanying text. (b) Venn diagram showing the overlap of targeted genome regions for all three platforms. (c) Venn diagram showing coverage of RefSeq coding exons and overlap between platforms. (d,e) Same as c, but for Ensembl CDS exons and RefSeq UTR exons respectively.
Figure 2
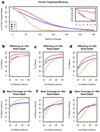
Efficiency trends by platform. (a) Efficiency visualized as the percent of total targeted bases covered at particular depths. Inset: Zoomed view of top left corner of the graph. (b–d) The percent of targeted bases covered at >10-fold, >20-fold and >30-fold read depth, respectively, at increasing read count thresholds. (e–g) The total number of bases covered at >10-fold, >20-fold and >30-fold read depth, respectively, at increasing read count thresholds.
Figure 3
Off-target enrichment and GC bias. (a) Off-target enrichment by platform is represented by total number of on-target (green) and off-target (gray) post-alignment reads from data sets normalized to 80M reads total. (b,c) The percent of on-target and off-target reads that overlap RepeatMasker entries (b) and known segmental duplications (c). A higher percent of off-target reads map overlap RepeatMasker entries and segmental duplications than on-target reads. (d,e,f) Density plot shows the correlation between mean read depth across targeted regions and GC content in the Agilent exome sequencing data (d), Nimblegen (e) and Illumina (f). GC content across every target region was determined by dividing the number of G and C bases by the total number of bases in the target region. Mean read depth was determined across each target region independently. These plots were generated with smoothScatter from the Bioconductor package “geneplotter” (
).
Figure 4
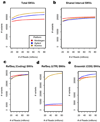
SNV trends by platform. Sensitivity toward SNVs is compared between each platform at increasing read counts. (a) Total number of SNVs detected at increasing read count thresholds. Sensitivity increases at higher read counts, particularly for the lower efficiency platforms. (b) SNVs detected in bases targeted by all three platforms. Nimblegen detects the most SNVs at all read counts because it is the most efficient. There is <2% increase in total variants detected for all platforms past 50M reads. (c) SNVs detected in RefSeq coding exons. These curves match the shared interval curves very closely because the genomic region shared by all three platforms is made up almost entirely by the RefSeq coding exons. (d) SNVs detected in RefSeq UTRs. UTRs are generally only targeted by the Illumina platform, so it detects far more in the UTRs at all read counts. (e) SNVs detected in Ensembl CDS. The Nimblegen and Illumina curves are very similar to their RefSeq coding curves in c. The Agilent curve is shifted upwards compared to its RefSeq coding curve because Agilent targets a large segment (1.4 Mb) of Ensembl CDS missed by the other two platforms.
Figure 5
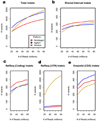
Sensitivity toward indels compared between each platform at increasing read counts. Indel sensitivity may be more intimately tied to factors such as bait length and density compared with SNV sensitivity. (a) Total number of indels detected at increasing read count thresholds. As with SNVs, sensitivity increases at higher read counts. Agilent detects the highest quantity at lower read counts because its baits appear more robust toward indels than Illumina’s. (b) Indels detected in bases targeted by all three platforms. Nimblegen detects the most indels at all read counts because it is the most efficient. Very few indels are detected in the shared interval because it is mostly made up of coding exons, which have a strong bias against indels. (c) Indels detected in RefSeq coding exons. These curves match the shared interval curves very closely, much like for SNVs. (d) Indels detected in RefSeq UTRs. Again, Illumina detects far more of these because it is the only platform that specifically targets UTRs. (e) Indels detected in Ensembl CDS. Agilent detects the most indels in Ensembl CDS due to a combination of the additional 1.4 Mb of targeted Ensembl CDS bases and its high sensitivity toward indels.
Figure 6
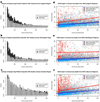
SNVs detected uniquely by exome sequencing or WGS, but not both. A standard WGS experiment at 35× mean genomic coverage was compared to exome sequencing experiments on each platform at 50M reads yielding exome target coverage of 30× for Illumina, 60× for Agilent and 68× for Nimblegen. SNVs were called in the WGS and then restricted to the regions targeted by each platform for comparison. (a) SNVs called in Agilent target regions by exome sequencing and WGS plotted as a function of coverage in exome sequencing versus coverage in WGS. Gray dots represent SNVs detected by both exome sequencing and WGS. Blue dots represent SNVs uniquely called by exome sequencing. Red dots represent SNVs uniquely called by WGS. (b,c) The same plot as for a, but for Nimblegen and Illumina, respectively. For all three exome sequencing platforms, SNVs detected uniquely by exome sequencing had lower than average coverage in WGS. SNVs detected uniquely by WGS were often in targets with zero or very low coverage by exome sequencing. (d) Venn diagram of SNVs detected by Agilent exome sequencing and WGS across Agilent targets. SNVs detected by both are in the green section. True-positive exome sequencing–specific SNVs are divided into novel (yellow) and known (red) slices. True-positive WGS-specific SNVs are divided into novel (orange) and known (blue) slices. False positives are in brown. (e,f) Same as d, but for Nimblegen (e) and Illumina (f), respectively.
Similar articles
- Variant detection sensitivity and biases in whole genome and exome sequencing.
Meynert AM, Ansari M, FitzPatrick DR, Taylor MS. Meynert AM, et al. BMC Bioinformatics. 2014 Jul 19;15(1):247. doi: 10.1186/1471-2105-15-247. BMC Bioinformatics. 2014. PMID: 25038816 Free PMC article. - New insights into the performance of human whole-exome capture platforms.
Meienberg J, Zerjavic K, Keller I, Okoniewski M, Patrignani A, Ludin K, Xu Z, Steinmann B, Carrel T, Röthlisberger B, Schlapbach R, Bruggmann R, Matyas G. Meienberg J, et al. Nucleic Acids Res. 2015 Jun 23;43(11):e76. doi: 10.1093/nar/gkv216. Epub 2015 Mar 27. Nucleic Acids Res. 2015. PMID: 25820422 Free PMC article. - Comprehensive comparison of three commercial human whole-exome capture platforms.
Asan, Xu Y, Jiang H, Tyler-Smith C, Xue Y, Jiang T, Wang J, Wu M, Liu X, Tian G, Wang J, Wang J, Yang H, Zhang X. Asan, et al. Genome Biol. 2011 Sep 28;12(9):R95. doi: 10.1186/gb-2011-12-9-r95. Genome Biol. 2011. PMID: 21955857 Free PMC article. - Exome versus transcriptome sequencing in identifying coding region variants.
Ku CS, Wu M, Cooper DN, Naidoo N, Pawitan Y, Pang B, Iacopetta B, Soong R. Ku CS, et al. Expert Rev Mol Diagn. 2012 Apr;12(3):241-51. doi: 10.1586/erm.12.10. Expert Rev Mol Diagn. 2012. PMID: 22468815 Review. - Critical points for an accurate human genome analysis.
White SJ, Laros JFJ, Bakker E, Cambon-Thomsen A, Eden M, Leonard S, Lochmüller H, Matthijs G, Mattocks C, Patton S, Payne K, Scheffer H, Souche E, Thomassen E, Thompson R, Traeger-Synodinos J, Van Vooren S, Janssen B, den Dunnen JT. White SJ, et al. Hum Mutat. 2017 Aug;38(8):912-921. doi: 10.1002/humu.23238. Epub 2017 Jun 16. Hum Mutat. 2017. PMID: 28471515 Review.
Cited by
- Genes to therapy: a comprehensive literature review of whole-exome sequencing in neurology and neurosurgery.
Tan JK, Awuah WA, Ahluwalia A, Sanker V, Ben-Jaafar A, Tenkorang PO, Aderinto N, Mehta A, Darko K, Shah MH, Roy S, Abdul-Rahman T, Atallah O. Tan JK, et al. Eur J Med Res. 2024 Nov 10;29(1):538. doi: 10.1186/s40001-024-02063-4. Eur J Med Res. 2024. PMID: 39523358 Free PMC article. Review. - The Response of Rhizosphere Microbial C and N-Cycling Gene Abundance of Sand-Fixing Shrub to Stand Age Following Desert Restoration.
Li Y, Wang B, Wang Z, He W, Wang Y, Liu L, Yang H. Li Y, et al. Microorganisms. 2024 Aug 23;12(9):1752. doi: 10.3390/microorganisms12091752. Microorganisms. 2024. PMID: 39338427 Free PMC article. - Pan-cancer discovery of somatic mutations from RNA sequencing data.
Tang G, Liu X, Cho M, Li Y, Tran DH, Wang X. Tang G, et al. Commun Biol. 2024 May 23;7(1):619. doi: 10.1038/s42003-024-06326-y. Commun Biol. 2024. PMID: 38783092 Free PMC article. - Bioinformatics of germline variant discovery for rare disease diagnostics: current approaches and remaining challenges.
Barbitoff YA, Ushakov MO, Lazareva TE, Nasykhova YA, Glotov AS, Predeus AV. Barbitoff YA, et al. Brief Bioinform. 2024 Jan 22;25(2):bbad508. doi: 10.1093/bib/bbad508. Brief Bioinform. 2024. PMID: 38271481 Free PMC article. Review. - Human whole-exome genotype data for Alzheimer's disease.
Leung YY, Naj AC, Chou YF, Valladares O, Schmidt M, Hamilton-Nelson K, Wheeler N, Lin H, Gangadharan P, Qu L, Clark K, Kuzma AB, Lee WP, Cantwell L, Nicaretta H; Alzheimer’s Disease Sequencing Project; Haines J, Farrer L, Seshadri S, Brkanac Z, Cruchaga C, Pericak-Vance M, Mayeux RP, Bush WS, Destefano A, Martin E, Schellenberg GD, Wang LS. Leung YY, et al. Nat Commun. 2024 Jan 23;15(1):684. doi: 10.1038/s41467-024-44781-7. Nat Commun. 2024. PMID: 38263370 Free PMC article.
References
Publication types
MeSH terms
Substances
LinkOut - more resources
Full Text Sources
Other Literature Sources


