D,L-sulforaphane-induced apoptosis in human breast cancer cells is regulated by the adapter protein p66Shc - PubMed (original) (raw)
D,L-sulforaphane-induced apoptosis in human breast cancer cells is regulated by the adapter protein p66Shc
Kozue Sakao et al. J Cell Biochem. 2012 Feb.
Abstract
Cancer chemopreventive response to D,L-sulforaphane (SFN), a synthetic racemic analogue of broccoli constituent L-sulforaphane, is partly attributable to apoptosis induction, but the mechanism of cell death is not fully understood. The present study demonstrates a critical role for adapter protein p66(Shc) in SFN-induced apoptosis. Immortalized mouse embryonic fibroblasts (MEF) derived from p66(shc) knockout mice were significantly more resistant to SFN-induced apoptosis, collapse of mitochondrial membrane potential, and reactive oxygen species (ROS) production compared with MEF obtained from the wild-type mice. Notably, a spontaneously immortalized and non-tumorigenic human mammary epithelial cell line (MCF-10A) was resistant to SFN-induced ROS production and apoptosis. Stable overexpression of manganese superoxide dismutase in MCF-7 and MDA-MB-231 human breast cancer cells conferred near complete protection against SFN-induced apoptosis and mitochondrial membrane potential collapse. SFN treatment resulted in increased S36 phosphorylation and mitochondrial translocation of p66(shc) in MDA-MB-231 and MCF-7 cells, and SFN-induced apoptosis was significantly attenuated by RNA interference of p66(shc) in both cells. SFN-treated MDA-MB-231 and MCF-7 cells also exhibited a marked decrease in protein level of peptidyl prolyl isomerase (Pin1), which is implicated in mitochondrial translocation of p66(shc) . However, stable overexpression of Pin1 failed to alter proapoptotic response to SFN at least in MCF-7 cells. Finally, SFN-induced S36 phosphorylation of p66(Shc) was mediated by protein kinase Cβ (PKCβ), and pharmacological inhibition of PKCβ significantly inhibited apoptotic cell death resulting from SFN exposure. In conclusion, the present study provides new insight into the mechanism of SFN-induced apoptosis involving PKCβ -mediated S36 phosphorylation of p66(shc).
Copyright © 2011 Wiley Periodicals, Inc.
Figures
Fig. 1
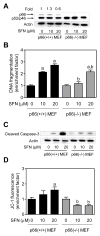
Immortalized mouse embryonic fibroblasts (MEF) derived from p66Shc knockout mice were resistant to D,L-sulforaphane (SFN)-induced apoptosis. A: Western blotting for total p66Shc protein using lysates from MEF derived from wild -type mice [p66(+/+) MEF] and p66Shc knockout mice [p66(−/−) MEF] and treated for 24 hours with dimethyl sulfoxide (DMSO; control) or the indicated concentrations of SFN. Numbers above the bands represent densitometric quantitation of change in protein level relative to DMSO-treated control. B: Quantitation of histone-associated DNA fragment release into the cytosol(a measure of apoptosis), C: Western blotting for cleaved caspase-3, and D: Flow cytometric quantitation of monomeric (green) JC-1 fluorescence (a measure of mitochondrial membrane potential) in p66(+/+) MEF and p66(−/−) MEF after 24-hour treatment with DMSO (control) or the indicated concentrations of SFN. Each experiment was done at least twice and representative data from one such experiment are shown. For quantitative measurements (panels B and D) results are expressed as enrichment factor relative to DMSO-treated p66(+/+) MEF (mean ± SD, n = 3). Significantly different (P<0.05) compared with arespective DMSO-treated control for each cell line, and bbetween SFN-treated p66(+/+) MEF and SFN-treated p66(−/−) MEF by one-way ANOVA followed by Bonferroni’s test.
Fig. 2
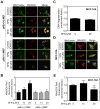
D,L-Sulforaphane (SFN)treatment caused ROS generation in immortalized mouse embryonic fibroblasts (MEF) derived from wild-type mice [p66(+/+) MEF] but not in p66(−/−) MEF or MCF-10A cells. A: Fluorescence microscopy for MitoSOX Red fluorescence (a measure of reactive oxygen species generation) in p66(+/+) MEF and p66(−/−) MEF after 4-hour treatment with dimethyl sulfoxide (DMSO)or the indicated concentrations of SFN. Staining for mitochondria (MitoTracker green) and MitoSOX Red is indicated by green and red colors, respectively. B: Flow cytometric quantitation of MitoSOX Red fluorescence in p66(+/+) MEF and p66(−/−) MEF after 4-hour treatment with DMSO or the indicated concentrations of SFN. Results are expressed as enrichment of MitoSOX Red fluorescence relative to DMSO-treated p66(+/+) MEF (mean ± SD, n = 3). Significantly different (P<0.05) compared with arespective DMSO-treated control for each cell line, and bbetween SFN-treated p66(+/+) MEF and SFN-treated p66(−/−) MEF by one-way ANOVA followed by Bonferroni’s test. C: Quantitation of histone-associated DNA fragment release into the cytosol in MCF-10A cells after 24-hour treatment with DMSO or 20 μM SFN. Results shown are mean ± SD (n = 3). D: Fluorescence microscopy for MitoSOX Red fluorescence in MCF-10A cells after 4-hour treatment with DMSO or the indicated concentrations of SFN. Note that SFN treatment did not increase MitoSOX Red fluorescence over DMSO-treated control. E: Flow cytometric analysis of MitoSOX Red fluorescence in DMSO-treated control and SFN-treated MCF-10A cells (4-hour treatment). Results are shown as enrichment factor relative to DMSO-treated control (mean ± SD, n = 6). aSignificantly different(P<0.05)compared with DMSO-treated control by one-way ANOVA with Dunnett’s adjustment. All experiments were repeated at least twice.
Fig. 3
Manganese-superoxide dismutase (Mn-SOD) overexpression attenuated D,L-sulforaphane (SFN)-induced apoptosis in MCF-7 cells. A: Immunoblotting for Mn-SOD using lysates from MCF-7 cells stably transfected with empty vector or vector encoding for Mn-SOD and treated for 24 hours with dimethyl sulfoxide (DMSO; control) or the indicated concentrations of SFN. Numbers above the bands represent densitometric quantitation of change in protein level relative to empty vector transfected cells treated with DMSO. B: Representative flow histograms depicting apoptotic fraction in MCF-7 cells stably transfected with empty vector or vector encoding for Mn-SOD and treated for 24 hours with DMSO (control) or 20 μM SFN. C: Quantitation of % apoptotic fraction (early + late apoptotic cells) in MCF-7 cells stably transfected with empty vector or vector encoding for Mn-SOD and treated for 24 hours with DMSO (control) or the indicated concentrations of SFN. D: Flow cytometric quantitation of monomeric (green) JC-1 fluorescence in MCF-7 cells stably transfected with empty vector or vector encoding for Mn-SOD and treated for 24 hours with DMSO (control) or the indicated concentrations of SFN. For quantitative measurements (panels C and D) results are expressed relative to DMSO-treated empty vector cells (mean ± SD, n = 3). Significantly different (P<0.05) compared with arespective DMSO-treated control for each cell line, and bbetween SFN-treated empty vector transfected cells and SFN-treated Mn-SOD overexpressing MCF-7 cells by one-way ANOVA followed by Bonferroni’s test. Each experiment was done at least twice and representative from one such experiment are shown.
Fig. 4
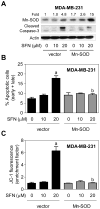
Manganese-superoxide dismutase (Mn-SOD) overexpression inhibited D,L-sulforaphane (SFN)-induced apoptosis in MDA-MB-231 cells. A: Immunoblotting for Mn-SOD and cleaved caspase-3 using lysates from MDA-MB-231 cells stably transfected with empty vector or vector encoding for Mn-SOD and treated for 24 hours with dimethyl sulfoxide (DMSO; control) or the indicated concentrations of SFN. Numbers above the bands represent densitometric quantitation of change in protein level relative to empty vector transfected cells treated with DMSO. B: Quantitation of % apoptotic fraction (early + late apoptotic cells) in MDA-MB-231 cells stably transfected with empty vector or vector encoding for Mn-SOD and treated for 24 hours with DMSO (control) or the indicated concentrations of SFN. C: Flow cytometric quantitation of monomeric (green) JC-1 fluorescence in MDA-MB-231 cells stably transfected with empty vector or vector encoding for Mn-SOD and treated for 24 hours with DMSO (control) or the indicated concentrations of SFN. For quantitative measurements (panels B and C) results are expressed relative to DMSO-treated empty vector cells (mean ± SD, n = 3). Significantly different (P<0.05) compared with arespective DMSO-treated control for each cell line, and bbetween SFN-treated empty vector transfected cells and SFN-treated Mn-SOD overexpressing MDA-MB-231 cells by one-way ANOVA followed by Bonferroni’s test. Each experiment was done at least twice and representative from one such experiment are shown.
Fig. 5
Knockdown of p66Shc conferred protection against D,L-sulforaphane (SFN)-induced apoptosis in MDA-MB-231 cells. A: Immunoblotting for total and S36 phosphorylated p66Shc using lysates from MDA-MB-231 cells treated with dimethyl sulfoxide (DMSO; control) or SFN (10 or 20 μM) for the indicated time periods. Numbers above the bands represent densitometric quantitation of change in protein level relative to corresponding DMSO-treated control at each time point. B: Immunofluorescence microscopic analysis of p66Shc in Mito-GFP transfected MDA-MB-231 cells after 8-hour treatment with DMSO or the indicated concentrations of SFN. C: Immunoblotting for total and S36 phosphorylated p66Shc and cleaved caspase-3 using lysates from MDA-MB-231 cells transiently transfected with a control (nonspecific) siRNA or a p66Shc-targeted siRNA and treated for 24 hours with DMSO or the indicated concentrations of SFN. Numbers on top of the immunoreactive bands represent densitometric quantitation of changes in protein levels relative to control siRNA transfected cells treated with DMSO. D: Quantitation of histone-associated DNA fragment release into the cytosol in MDA-MB-231 cells transiently transfected with a control siRNA or a p66Shc-targeted siRNA and treated for 24 hours with DMSO or the indicated concentrations of SFN. The results are expressed as enrichment factor relative to DMSO-treated MDA-MB-231 cells transfected with the control siRNA (mean ± SD, n = 3). Significantly different (P<0.05) compared with arespective DMSO-treated control, and bbetween SFN-treated control siRNA transfected cells and SFN-treated p66Shc siRNA transfected cells by one-way ANOVA followed by Bonferroni’s test. Each experiment was done at least twice, and representative data from a single experiment are shown.
Fig. 6
RNA interference of p66Shc attenuated SFN-induced apoptosis in MCF-7 cells. A: Immunoblotting for total and S36 phosphorylated p66Shc using lysates from MCF -7 cells treated with dimethyl sulfoxide (DMSO; control) or SFN (10 or 20 μM) for the indicated time periods. Numbers above the bands represent densitometric quantitation of change in protein level relative to corresponding DMSO-treated control at each time point. B: Immunofluorescence microscopic analysis for p66Shc in Mito -GFP transfected MCF-7 cells after 8-hour treatment with DMSO or 10 μM SFN. C: Immunoblotting for total and S36 phosphorylated p66Shc using lysates from MCF -7 cells transiently transfected with a control (nonspecific) siRNA or a p66Shc- targeted siRNA and treated for 24 hours with DMSO or 10 μM SFN. Numbers on top of the immunoreactive bands represent changes in protein levels relative to control siRNA transfected cells treated with DMSO. D: Quantitation of histone-associated DNA fragment release into the cytosol in MCF-7 cells transiently transfected with a control siRNA or a p66Shc-targeted siRNA and treated for 24 hours with DMSO or 10 μM SFN. The results are expressed as enrichment factor relative to DMSO-treated cells transiently transfected with the control siRNA (mean ± SD, n = 3). Significantly different (P<0.05)compared with arespective DMSO-treated control, and bbetween SFN-treated control siRNA transfected cells and SFN-treated p66Shc siRNA transfected cells by one-way ANOVA followed by Bonferroni’s test. Each experiment was performed at least twice, and representative data from a single experiment are shown.
Fig. 7
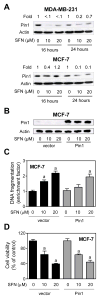
Peptidyl prolyl isomerase (Pin1)was dispensable for D,L-sulforaphane (SFN)-induced apoptosis. A: Immunoblotting for Pin1 using lysates from MDA-MB-231 and MCF-7 cells treated for 16-or 24 -hour with dimethyl sulfoxide (DMSO)or the indicated concentrations of SFN. Numbers above the bands represent densitometric quantitation of change in protein level relative to corresponding DMSO-treated control at each time point. B: Immunoblotting for Pin1 using lysates for MCF-7 cells stably transfected with empty vector or vector encoding for myc-Pin1 and treated for 24 hours with DMSO or the indicated concentrations of SFN. C: Histone-associated DNA fragment release into the cytosol, and D: cell viability in MCF-7 cells stably transfected with empty vector or vector encoding for myc-Pin1 and treated for 24 hours with DMSO or the indicated concentrations of SFN. Results are expressed relative to DMSO-treated cells transfected with empty vector (mean ± SD, n = 3). Significantly different (P<0.05) compared with arespective DMSO-treated control, and bbetween SFN-treated empty vector transfected cells and SFN-treated myc-Pin1 overexpressing cells by one-way ANOVA followed by Bonferroni’s test. Each experiment was done at least twice, and representative data from a single experiment are shown.
Fig. 8
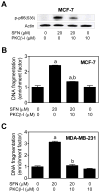
Phosphorylation (S36) of p66Shc was mediated by protein kinase Cβ (PKCβ). A: Immunoblotting for S36 phosphorylated p66Shc using lysates from MCF -7 cells treated for 24 hours with 20 μM D,L-sulforaphane (SFN)and/or 10 μM PKCβ inhibitor (PKCβ-I). B: Histone-associated DNA fragment release into the cytosol in MCF-7 cells, and C: Histone-associated DNA fragment release into the cytosol in MDA-MB-231 cells after 24-hour treatment with 20 μM SFN and/or 10 μM PKCβ inhibitor (PKCβ-I). Results are expressed as enrichment factor relative to DMSO-treated control cells (mean ± SD, n = 3). Significantly different (P<0.05) compared with aDMSO-treated control, and bSFN treatment groups in the absence or presence of the PKCβ-I by one-way ANOVA followed by Bonferroni’s test.
Similar articles
- p66Shc is indispensable for phenethyl isothiocyanate-induced apoptosis in human prostate cancer cells.
Xiao D, Singh SV. Xiao D, et al. Cancer Res. 2010 Apr 15;70(8):3150-8. doi: 10.1158/0008-5472.CAN-09-4451. Epub 2010 Mar 30. Cancer Res. 2010. PMID: 20354186 Free PMC article. - Propofol protects against angiotensin II-induced mouse hippocampal HT22 cells apoptosis via inhibition of p66Shc mitochondrial translocation.
Zhu M, Chen J, Wen M, Sun Z, Sun X, Wang J, Miao C. Zhu M, et al. Neuromolecular Med. 2014 Dec;16(4):772-81. doi: 10.1007/s12017-014-8326-6. Epub 2014 Aug 24. Neuromolecular Med. 2014. PMID: 25151272 - Oxidative stress stimulates apoptosis and activates NF-kappaB in osteoblastic cells via a PKCbeta/p66shc signaling cascade: counter regulation by estrogens or androgens.
Almeida M, Han L, Ambrogini E, Bartell SM, Manolagas SC. Almeida M, et al. Mol Endocrinol. 2010 Oct;24(10):2030-7. doi: 10.1210/me.2010-0189. Epub 2010 Aug 4. Mol Endocrinol. 2010. PMID: 20685851 Free PMC article. - p66(Shc) protein, oxidative stress, and cardiovascular complications of diabetes: the missing link.
Francia P, Cosentino F, Schiavoni M, Huang Y, Perna E, Camici GG, Lüscher TF, Volpe M. Francia P, et al. J Mol Med (Berl). 2009 Sep;87(9):885-91. doi: 10.1007/s00109-009-0499-3. Epub 2009 Jul 10. J Mol Med (Berl). 2009. PMID: 19590843 Review. - Modulation of mitochondrial functions by the indirect antioxidant sulforaphane: a seemingly contradictory dual role and an integrative hypothesis.
Negrette-Guzmán M, Huerta-Yepez S, Tapia E, Pedraza-Chaverri J. Negrette-Guzmán M, et al. Free Radic Biol Med. 2013 Dec;65:1078-1089. doi: 10.1016/j.freeradbiomed.2013.08.182. Epub 2013 Aug 30. Free Radic Biol Med. 2013. PMID: 23999506 Review.
Cited by
- The role of polycomb group protein Bmi-1 and Notch4 in breast cancer stem cell inhibition by benzyl isothiocyanate.
Kim SH, Singh SV. Kim SH, et al. Breast Cancer Res Treat. 2015 Feb;149(3):681-92. doi: 10.1007/s10549-015-3279-5. Epub 2015 Feb 8. Breast Cancer Res Treat. 2015. PMID: 25663545 Free PMC article. - Combination of lapatinib with isothiocyanates overcomes drug resistance and inhibits migration of HER2 positive breast cancer cells.
Kaczyńska A, Herman-Antosiewicz A. Kaczyńska A, et al. Breast Cancer. 2017 Mar;24(2):271-280. doi: 10.1007/s12282-016-0700-9. Epub 2016 May 6. Breast Cancer. 2017. PMID: 27154770 Free PMC article. - The Epigenetic Impact of Cruciferous Vegetables on Cancer Prevention.
Royston KJ, Tollefsbol TO. Royston KJ, et al. Curr Pharmacol Rep. 2015 Feb 1;1(1):46-51. doi: 10.1007/s40495-014-0003-9. Curr Pharmacol Rep. 2015. PMID: 25774338 Free PMC article. - Cancer chemoprevention with dietary isothiocyanates mature for clinical translational research.
Singh SV, Singh K. Singh SV, et al. Carcinogenesis. 2012 Oct;33(10):1833-42. doi: 10.1093/carcin/bgs216. Epub 2012 Jun 27. Carcinogenesis. 2012. PMID: 22739026 Free PMC article. Review. - p66Shc Protein-Oxidative Stress Sensor or Redox Enzyme: Its Potential Role in Mitochondrial Metabolism of Human Breast Cancer.
Prill M, Sardão VA, Sobczak M, Nowis D, Szymanski J, Wieckowski MR. Prill M, et al. Cancers (Basel). 2024 Sep 28;16(19):3324. doi: 10.3390/cancers16193324. Cancers (Basel). 2024. PMID: 39409944 Free PMC article.
References
- Barcelo S, Gardiner JM, Gescher A, Chipman JK. CYP2E1-mediated mechanism of anti-genotoxicity of the broccoli constituent sulforaphane. Carcinogenesis. 1996;17:277–282. - PubMed
- Bertl E, Bartsch H, Gerhauser C. Inhibition of angiogenesis and endothelial cell functions are novel sulforaphane-mediated mechanisms in chemoprevention. Mol Cancer Ther. 2006;5:575–585. - PubMed
- Choi S, Singh SV. Bax and Bak are required for apoptosis induction by sulforaphane, a cruciferous vegetable-derived cancer chemopreventive agent. Cancer Res. 2005;65:2035–2043. - PubMed
- Chung FL, Conaway CC, Rao CV, Reddy BS. Chemoprevention of colonic aberrant crypt foci in Fischer rats by sulforaphane and phenethyl isothiocyanate. Carcinogenesis. 2000;21:2287–2291. - PubMed
- Fahey JW, Zalcmann AT, Talalay P. The chemical diversity and distribution of glucosinolates and isothiocyanates among plants. Phytochemistry. 2001;56:5–51. - PubMed
Publication types
MeSH terms
Substances
LinkOut - more resources
Full Text Sources
Research Materials
Miscellaneous
