A pseudoatomic model of the dynamin polymer identifies a hydrolysis-dependent powerstroke - PubMed (original) (raw)
A pseudoatomic model of the dynamin polymer identifies a hydrolysis-dependent powerstroke
Joshua S Chappie et al. Cell. 2011.
Abstract
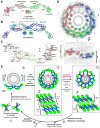
The GTPase dynamin catalyzes membrane fission by forming a collar around the necks of clathrin-coated pits, but the specific structural interactions and conformational changes that drive this process remain a mystery. We present the GMPPCP-bound structures of the truncated human dynamin 1 helical polymer at 12.2 Å and a fusion protein, GG, linking human dynamin 1's catalytic G domain to its GTPase effector domain (GED) at 2.2 Å. The structures reveal the position and connectivity of dynamin fragments in the assembled structure, showing that G domain dimers only form between tetramers in sequential rungs of the dynamin helix. Using chemical crosslinking, we demonstrate that dynamin tetramers are made of two dimers, in which the G domain of one molecule interacts in trans with the GED of another. Structural comparison of GG(GMPPCP) to the GG transition-state complex identifies a hydrolysis-dependent powerstroke that may play a role in membrane-remodeling events necessary for fission.
Copyright © 2011 Elsevier Inc. All rights reserved.
Figures
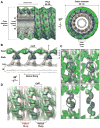
Figure 1. 12.2 Å reconstruction of ΔPRD in the constricted state reveals new structural features of the assembled dynamin polymer
A. Structure of the ΔPRD polymer. Two density thresholds of the ΔPRD map are shown: the lower threshold is colored gray, the higher threshold is in mesh and colored radially to denote the locations of the ‘leg’ (orange), ‘stalk’ (blue), and ‘head’ (green) regions. Left panel shows a side view of the decorated helical tube oriented perpendicular to the helical axis. A section of the tube’s outer surface has been removed to show the interior of the structure in cross-section. The membrane bilayer (M), inner luminal diameter, outer tube diameter, and pitch are labeled. Black box denotes section of map highlighted in B. Right panel is an end-on view of the tube looking down the helical axis that is rotated 90° relative to the view on the left. B. Cross-section through ΔPRD polymer, the classical ‘T-view’ of dynamin subunits within individual helical rungs. The ‘leg’, ‘stalk’, ‘head’, and membrane bilayer (M) density regions are labeled and colored as in A. The cleft separating ‘head’ densities within the same helical run is labeled. Dashed lines (1–4) indicate the locations of planar slices through a single helical rung that are shown in C with orientation defined by black arrow. C. Sequential planar sections through a single helical rung shows the crisscross twisting of the dynamin stalk density. Black circles highlight intersection point of stalk density. Black dashed boxes in section 1 highlight the newly resolved strips of density visible in the cleft between G domains in the same helical rung. D. Two additional strips of density (dashed red and black boxes) are visible in the cleft along the exterior of the structure and form continuous connections with the head densities of a single helical rung. Subunits belonging to alternating helical rungs are colored as red and black for distinction. View is rotated 90° relative to B.
Figure 2. Computational docking of crystallized fragments derived from dynamin family members
A. Crystal structures of isolated domains from different dynamin family members. From left to right: GDP.AlF4−-stabilized dimer of the GTPase-GED fusion (GG) from human dynamin 1 (PDB 2×2e, green), including the G domain and the BSE; stalk dimer from human MxA (PDB 3ljb, blue), which includes the middle domain and GED; dynamin 1 PH domain (PDB 1dyn, orange). B. Computational docking of structures in A into the ΔPRD map (gray). A section of the ΔPRD tube is shown in an end-on view looking down the helical axis to highlight the positions of the docked fragments relative to the membrane bilayer (M). Solid vertical black line indicates orientation of the cross-section plane that is rotated by 90° on panel C. Dashed black lines denote the planar sections that are rotated by 90° and shown in panels D, H, and F. C. ‘T-view’ cross-section illustrating the positioning of domains within a single helical rung. M denotes membrane bilayer. D, E. Docking of PH domain monomers. (D) shows orientation of PH domains within the same helical rung. (E) depicts asymmetry of PH domain fitting. Variable loop 1 (VL1) is labeled. Orientation is the same as in the ‘T-view’ in C. F, G. Fitting of MxA stalk monomers. (F) shows a zoomed in top view perpendicular to the membrane bilayer. Four of MxA stalk monomers (colored blue and purple) are shown. Note that portions of each MxA monomer protrude from the ΔPRD density map (yellow boxes). (G) is rotated 90° and shows a side view of the stalk monomers in the same orientation as shown in B. Residues corresponding to the putative dynamin proline hinge are labeled in the MxA structure (yellow spheres). H, I. Two possible fittings of GGGDP.AlF4− monomers (green and red) viewed either from the top (H) or the side (I). The different orientations are related by a 180° rotation about an axis parallel to the membrane surface (H) and result in the CGED helix of the BSE (yellow) facing either up (green) or down (red). Each fitting generates a different connection with the stalk (I), in subunits that are either ‘extended’ or ‘kinked’ (J).
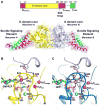
Figure 3. Structure of GGGMPPCP
A. Domain structure of the G domain-GED (GG) fusion protein from human dynamin 1 and the structure of its complex with GMPPCP. G domain cores are inyellow and light blue and the three helices of the BSE are shown as NGTPase, purple; CGTPase, purple; CGED, green. A highly conserved flexible hinge region (BSE hinge, red) connects the BSE to the G domain core. GMPPCP molecules (green) and active site waters (red spheres) are shown. B,C. Structural comparison of the GGGMPPCP (B, yellow) and GGGDP.AlF4− (C, dark blue, PDB 2X2E) active sites. The elements of the catalytic machinery are labeled in each structure along with the bound nucleotide (green), Mg2+ ion (green spheres), and catalytic and bridging waters (red spheres, H20cat and H20bridge respectively). The AlF4− (gray) and charge compensating sodium ion (purple sphere) are shown for GGGDP.AlF4−. An additional water molecule (H20cc, red sphere) occupies the ion-binding site in GGGMPPCP. The trans stabilizing loop and catalytic D180 residue from the adjacent monomer (colored light blue and labeled with subscript “B”) is shown at the top of each panel. Dashed black lines indicate hydrogen bonds.
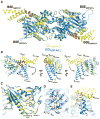
Figure 4. Structure of GGGMPPCP identifies a hydrolysis-dependent BSE conformational change
A. Structural superposition of GGGMPPCP (yellow) and GGGDP.AlF4− (blue, PDB: 2X2E). Note the different conformations of the BSE in each structure. The BSE hinge is colored red. B. Hydrolysis-dependent BSE conformational change. Left panel is superposition of GGGMPPCP and GGGDP.AlF4− monomers. The NGTPase, CGTPase, and CGED helices of the BSE are labeled. Black arrow depicts 68.81° downward rotation of the BSE that in the transition-state complex. Middle and right panels depict different views of the monomer superposition. Small black arrow in middle panel describes the slight counterclockwise twist that is coupled to the downward rotation of the BSE; black arrow in right panel describes combined translocation of BSE. C. BSE movement induces structural changes in the central β-sheet of the G domain core. β-strands 2–5, the α2 helix, and the β23 and β45 loops are labeled. Black arrows illustrate how these segments shift to accommodate the BSE. The GMPPCP (green), Mg2+ (green sphere), and active site waters (red spheres) from the GGGMPPCP structure are shown. D. Structural interactions between the BSE and G domain core in the GGGDP.AlF4− transition-state complex. Residues contributing to salt bridges and hydrophobic interactions are shown. Black dashed lines are hydrogen bonds. E. Structural changes of the NGTPase linker. The linker reconfigures into a short helix, allowing I23, L29, and L31 to form stabilizing interactions with the BSE hydrophobic core.
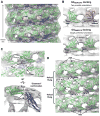
Figure 5. Docking of GGGMPPCP reveals putative G domain-stalk connectivity
A. Docked model of assembled ΔPRD polymer in the constricted state. GGGMPPCP monomers are colored green, middle/GED stalk monomers are colored blue, PH domains are colored orange, and the GMPPCP-bound ΔPRD reconstruction is rendered in gray. A side view is shown perpendicular to the helical axis. B. Comparison of GGGDP.AlF4− (top) and GGGMPPCP (bottom) monomer dockings. GGGMPPCP yields a single, preferred orientation where the CGED helix of the BSE (yellow) is on top. Monomers are shown in the same orientation as A. C. Zoomed side (upper panel, perpendicular to helical axis) and end (lower panel, looking down helical axis) views highlighting the putative G domain-stalk connectivity. Labels: CGTPase, C-terminus of G domain; Nstalk, N-terminus of the middle domain; Cstalk, C-terminal portion of GED present in MxA crystal structure; CGED, beginning of C-terminal GED helix present in GGGMPPCP structure. The proximity of CGTPase to Nstalk and Cstalk to CGED suggests that dynamin subunits adopt an ‘extended’ conformation. D. GGGMPPCP monomers in adjacent helical rungs are poised for dimerization (dashed black lines). The BSEs occupy the cleft densities above the stalk on the exterior of the map (black arrows).
Figure 6. Dynamin tetramer is a dimer of domain-swapped dimers
A. Cartoons illustrating possible G domain-GED interactions in full-length dynamin. Domains are colored as in C. Black ‘X’s denote expected crosslinks for each scenario. B. Chemical crosslinking of DynRCL R15C/R730C. Targeted crosslinking of the engineered cysteine residues in the NGTPase and CGED by MTS-1-MTS produces a prominent dimeric species while non-specific crosslinking of surface-reactive amines by BS3 primarily yields a tetramer. Crosslinking efficiency of the predominant species was unaffected by protein concentration. C. Cleavage products of Lys-C limited proteolysis (Muhlberg et al., 1997). D. Lys-C limited proteolysis and MTS-1-MTS crosslinking of WT and DynRCL R15C/R730C. Left panel shows Coomassie-stained gel of proteolyzed and/or crosslinked products; right panel shows western blotting of the same species. α-GTPase and α-GED are primary antibodies recognizing dynamin’s N-terminus (residues 2–17) and GED respectively.
Figure 7. Structural constraints of G domain dimerization and the dynamin powerstroke
A. Model for the domain-swapped dynamin dimer. In this configuration, a long dimer is formed by a full GED domain swap. Monomers are colored purple and green. An alternative model also consistent with our crosslinking data is shown in Figure S6. B. Putative arrangement of membrane-bound long dynamin tetramer derived from the docked model of assembled ΔPRD polymer (Figure 5). The tetramer is comprised of two of the domain-swapped dimers shown in A (colored blue and teal, labeled A and B). Black box indicates assembly interface between these dimers (see also Figure S7B). C. Structural mapping of mutations that impair dynamin oligomerization. A stalk monomer (teal) is shown in two orientations. Mutations within the putative assembly interface (yellow) are labeled and colored magenta; mutations that also produce assembly defects but are localized outside this interface are also shown and colored red. Dashed black circle defines assumed location of R399ADyn1 and YRGR440AAAAMxA, which are disordered in the crystal structure. Phenotypes are in Table S1. D. Assembly of long dynamin tetramer models within the GMPPCP-stabilized constricted ΔPRD map (gray). The numbering and rainbow coloring (red to purple) denotes the sequential addition of tetramers and terminates when the first G domain dimer is formed. Upper panel depicts end view of the long assembly looking down the helical axis, lower panel is a side view perpendicular to this axis. The sequential rungs of the dynamin helix are marked in the lower panel with black brackets and numbered as ‘1’ and ‘2’. Dashed black box highlights the partnering helical rungs facilitating G domain dimerization. E. Proposed pathway of dynamin-catalyzed membrane fission. Dynamin tetramers exist in an assembly incompetent conformation in solution (1). Membrane binding causes a conformational change in the tetramer that exposes the assembly interface, inducing the rapid, cooperative assembly of a helical dynamin collar at the neck of an invaginated clathrin-coated pit (CCP) (2). Initial constriction of the neck, triggered by GTP binding and structural changes in middle/GED stalk (Chen et al., 2004), promotes G domain dimerization between tetramers in adjacent helical rungs to optimally position dynamin’s catalytic machinery (3). Assembly-stimulated GTP hydrolysis drives a major rotation of the BSE in the transition-state that constitutes the dynamin powerstroke (4). Propagation of this change through multiple turns of the helical dynamin collar causes further constriction of the neck (4). The resulting structural rearrangements might play a role in loosening the dynamin scaffold from the membrane surface, facilitating the membrane remodeling events that contribute to membrane fission (5). The detached dynamin scaffold disassembles upon release of the hydrolyzed γ-phosphate (6), which stabilized the dimer interface. Coloring: G domains, green; middle/GED stalk, blue; PH domains, orange; membrane bilayer, gray; lipid head groups, gray circles. The large gray circle with cyan meshwork is the CCP. The assemblies are shown in the same orientations as in D, (upper panels 3, 4) and in side view on the lower panels. Red arrows indicate movements associated with the dynamin powerstroke. The 7 nm measurement (3) corresponds to the inner luminal diameter of our GMPPCP-stabilized ΔPRD reconstruction, which is poised for G domain dimerization and represents an intermediate along the fission pathway; the 4 nm measurement (4) indicates the theoretical inner luminal diameter of the neck that would allow the spontaneous formation of a hemifission intermediate following partial detachment of the dynamin scaffold.
Similar articles
- Cryo-EM of the dynamin polymer assembled on lipid membrane.
Kong L, Sochacki KA, Wang H, Fang S, Canagarajah B, Kehr AD, Rice WJ, Strub MP, Taraska JW, Hinshaw JE. Kong L, et al. Nature. 2018 Aug;560(7717):258-262. doi: 10.1038/s41586-018-0378-6. Epub 2018 Aug 1. Nature. 2018. PMID: 30069048 Free PMC article. - G domain dimerization controls dynamin's assembly-stimulated GTPase activity.
Chappie JS, Acharya S, Leonard M, Schmid SL, Dyda F. Chappie JS, et al. Nature. 2010 May 27;465(7297):435-40. doi: 10.1038/nature09032. Epub 2010 Apr 28. Nature. 2010. PMID: 20428113 Free PMC article. - An intramolecular signaling element that modulates dynamin function in vitro and in vivo.
Chappie JS, Acharya S, Liu YW, Leonard M, Pucadyil TJ, Schmid SL. Chappie JS, et al. Mol Biol Cell. 2009 Aug;20(15):3561-71. doi: 10.1091/mbc.e09-04-0318. Epub 2009 Jun 10. Mol Biol Cell. 2009. PMID: 19515832 Free PMC article. - Building a fission machine--structural insights into dynamin assembly and activation.
Chappie JS, Dyda F. Chappie JS, et al. J Cell Sci. 2013 Jul 1;126(Pt 13):2773-84. doi: 10.1242/jcs.108845. Epub 2013 Jun 18. J Cell Sci. 2013. PMID: 23781021 Free PMC article. Review. - Regulating dynamin dynamics during endocytosis.
Sundborger AC, Hinshaw JE. Sundborger AC, et al. F1000Prime Rep. 2014 Oct 1;6:85. doi: 10.12703/P6-85. eCollection 2014. F1000Prime Rep. 2014. PMID: 25374663 Free PMC article. Review.
Cited by
- Dynamin, a membrane-remodelling GTPase.
Ferguson SM, De Camilli P. Ferguson SM, et al. Nat Rev Mol Cell Biol. 2012 Jan 11;13(2):75-88. doi: 10.1038/nrm3266. Nat Rev Mol Cell Biol. 2012. PMID: 22233676 Free PMC article. Review. - Mechanics of dynamin-mediated membrane fission.
Morlot S, Roux A. Morlot S, et al. Annu Rev Biophys. 2013;42:629-49. doi: 10.1146/annurev-biophys-050511-102247. Annu Rev Biophys. 2013. PMID: 23541160 Free PMC article. Review. - A dynamin-actin interaction is required for vesicle scission during endocytosis in yeast.
Palmer SE, Smaczynska-de Rooij II, Marklew CJ, Allwood EG, Mishra R, Johnson S, Goldberg MW, Ayscough KR. Palmer SE, et al. Curr Biol. 2015 Mar 30;25(7):868-78. doi: 10.1016/j.cub.2015.01.061. Epub 2015 Mar 12. Curr Biol. 2015. PMID: 25772449 Free PMC article. - Direct Observation of In-Focus Plasmonic Cargos via Breaking Angular Degeneracy in Differential Interference Contrast Microscopy.
Kim GW, Ha JW. Kim GW, et al. JACS Au. 2023 Dec 2;3(12):3436-3445. doi: 10.1021/jacsau.3c00594. eCollection 2023 Dec 25. JACS Au. 2023. PMID: 38155657 Free PMC article. - Molecular mechanisms of mitochondrial dynamics.
Tábara LC, Segawa M, Prudent J. Tábara LC, et al. Nat Rev Mol Cell Biol. 2024 Oct 17. doi: 10.1038/s41580-024-00785-1. Online ahead of print. Nat Rev Mol Cell Biol. 2024. PMID: 39420231 Review.
References
- Brünger AT, et al. Crystallography & NMR System: a new software suite for macromolecular structure determination. Acta Cryst. 1998;D54:905–921. - PubMed
- Chen YJ, Zhang P, Egelman EH, Hinshaw JE. The stalk region of dynamin drives the constriction of dynamin tubes. Nat Struct Mol Biol. 2004;11:574–575. - PubMed
Publication types
MeSH terms
Substances
Grants and funding
- RR017573/RR/NCRR NIH HHS/United States
- P41 RR017573/RR/NCRR NIH HHS/United States
- GM75820/GM/NIGMS NIH HHS/United States
- R01 GM052468/GM/NIGMS NIH HHS/United States
- R01 GM042455/GM/NIGMS NIH HHS/United States
- R37 GM052468/GM/NIGMS NIH HHS/United States
- ZIA DK075049-01/ImNIH/Intramural NIH HHS/United States
- GM52468/GM/NIGMS NIH HHS/United States
- GM42455/GM/NIGMS NIH HHS/United States
- R01 GM075820/GM/NIGMS NIH HHS/United States
LinkOut - more resources
Full Text Sources
Other Literature Sources
Molecular Biology Databases
