Nephron formation adopts a novel spatial topology at cessation of nephrogenesis - PubMed (original) (raw)
Nephron formation adopts a novel spatial topology at cessation of nephrogenesis
Bree A Rumballe et al. Dev Biol. 2011.
Abstract
Nephron number in the mammalian kidney is known to vary dramatically, with postnatal renal function directly influenced by nephron complement. What determines final nephron number is poorly understood but nephron formation in the mouse kidney ceases within the first few days after birth, presumably due to the loss of all remaining nephron progenitors via epithelial differentiation. What initiates this event is not known. Indeed, whether nephron formation occurs in the same way at this time as during embryonic development has also not been examined. In this study, we investigate the key cellular compartments involved in nephron formation; the ureteric tip, cap mesenchyme and early nephrons; from postnatal day (P) 0 to 6 in the mouse. High resolution analyses of gene and protein expression indicate that loss of nephron progenitors precedes loss of ureteric tip identity, but show spatial shifts in the expression of cap mesenchyme genes during this time. In addition, cap mesenchymal volume and rate of proliferation decline prior to birth. Section-based 3D modeling and Optical Projection Tomography revealed a burst of ectopic nephron induction, with the formation of multiple (up to 5) nephrons per ureteric tip evident from P2. While the distal-proximal patterning of these nephrons occurred normally, their spatial relationship with the ureteric compartment was altered. We propose that this phase of nephron formation represents an acceleration of differentiation within the cap mesenchyme due to a displacement of signals within the nephrogenic niche.
Crown Copyright © 2011. Published by Elsevier Inc. All rights reserved.
Figures
Figure 1. Histology of the peripheral cortex during the first six postnatal days
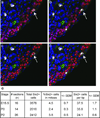
(a–d) Thin sections stained with PAS (Periodic Acid Schiff’s) for glycogen carbohydrates in basement membrane and renal proximal tubule brush border (magenta) from P0-6. The nephrogenic zone, not stained by PAS, is seen at the periphery of the kidney from P0-P2 and remains relatively constant in width during this time (bars in a–c). By P6, PAS stained tubules are seen at the kidney surface as the nephrogenic zone is replaced with the tubules of more mature nephrons (arrow in d). Scale bar in (a) = 100µm. (e–h) Thin sections stained with toluidine blue. At P0, cap mesenchyme (CM) is seen surrounding the ureteric tips (UT) and each UT is attached to a single nephron (e). At P2, early nephrons (RV-SSB) are seen close to the surface of the kidney. A single UT may be attached to more than one nephron (f). At P4 and P6 more mature nephron tubules are seen at the kidney edge (arrows in g–h). Scale bars = 200µm (a–d) and 30 µm (e–h). CM, cap mesenchyme; UT, ureteric tip; RV, renal vesicle; SSB, S-shaped body; UTr, ureteric trunk; CLN, capillary loop nephron.
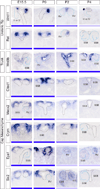
Figure 2. Gene expression implies exhaustion of nephron progenitors precedes loss of ureteric tip identity
Gene expression profiling of ureteric epithelium markers of tip (Wn11, Ret) and trunk (Wnt9b) and cap mesenchyme markers (Cited1, Meox2, Crym, Eya1, Six2) using SISH at E15.5, P0-4. Although Wnt9b is a marker of ureteric trunk, it was detected in the ureteric tip at P2-4. High magnification images of the nephrogenic zone are shown with ureteric tree outlined in black and nephrons outlined in blue. The expression strength (strong-weak) of each gene is represented as a blue bar underneath each image. The expression of ureteric markers in the tip was detectable until P4, whereas CM markers were detectable in the cap until P2. Eya1 and Six2 were present in nephron structures from P2-P4. RV, renal vesicle; SSB, S-shaped body; CLN, capillary loop nephron (Stage III nephron). Additional low magnification images of the entire kidney (E15.5, P0-6) are available in Supplementary Figure S1.
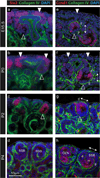
Figure 3. Presence of Six2 and Cyclin D1 proteins within renal vesicles during cessation of nephrogenesis
Immunofluorescence of embryonic and postnatal kidney sections using anti-Six2 (red, ad), anti-Cyclin D1 (Ccnd1; red, e–h) and anti-Collagen IV (green, a–h) antibodies to mark cap mesenchyme, proliferating cells in G1/S phase and basement membrane respectively. At E15.5 and P0, the cap mesenchyme (marked by white arrowheads) could be identified by strong Six2 expression (a, b). As the cap is lost (at P2), Six2 is strongly expressed in early nephrons (marked by open arrowheads) at the ends of the ureteric tips (c). However prior to this stage, weak Six2 expression was also seen in renal vesicles and pretubular aggregates underneath the tips at E15.5 and P0 (a–c). Ccnd1 displayed polarized expression in the distal renal vesicle in the embryonic kidney (open arrowhead in e), as shown previously (Georgas et al, 2009), which was maintained in distal RVs at P0 to P2 (open arrowheads in eg). In the embryonic and P0 kidney the proximal-distal polarity of early nephrons could be seen perpendicular to the kidney surface (arrow in e–f), however at P2 and P4, these nephrons (RV-SSB) appeared ‘rotated’ as their distal-proximal polarity could be seen parallel to the surface of the kidney (arrows in g–h). The edge of the kidney is outlined. SSB, S-shaped body; CLN, capillary loop nephron; d, distal; m, medial; p, proximal. Low magnification images are available in Supplementary Figure S2.
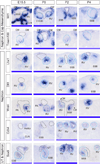
Figure 4. Gene expression of early nephron markers reveal changes in the spatial relationships between the forming nephrons, ureteric tip and kidney periphery during postnatal nephrogenesis
Gene expression profiling of nephron markers using SISH at E15.5, P0-4. Genes included proximal nephron markers (Wt1, Tmem100) also present in the cap mesenchyme. Nephron markers included genes marking the distal renal vesicle (Lhx1, Dll1) and genes present in both sides of the renal vesicle (Wnt4, Cdh4). Sox9 was present in nephrons as well as in the ureteric tree. High magnification images of the nephrogenic zone are shown with ureteric tree outlined in black and nephrons outlined in blue. The expression strength (strong-weak) of each gene in early nephrons is represented as a blue bar. The profiling shows that expression of nephron markers was detectable until P4. Tmem100 weakly expressed in the cap mesenchyme at E15.5 appeared to be upregulated in the cap postnatally, most notable at P0. Wnt4, present in nephrons as early as pretubular aggregate stage, appeared to be present in the cap mesenchyme at P2 (arrows), although this mesenchymal expression may be early pretubular aggregates surrounding the P2 ureteric tips. PA, pretubular aggregate; RV, renal vesicle; SSB, S-shaped body; III or IV, stage III or IV nephron epithelia. Additional low magnification images of the entire kidney (E15.5, P0-6) are shown in Supplementary Figure S4.
Figure 5. Maintained nephron patterning but altered orientation during cessation of nephrogenesis
Section in situ hybridization for Dll1 in early nephrons shows that polarity in renal vesicles (RV) with respect to the position of the ureteric tip, first demonstrated at E15.5 (Georgas et al, 2009), is maintained by RVs that develop postnatally. However, because the RVs develop in a different location with respect to the ureteric tip (at the tip ends) at P4, rather than underneath the ureteric tips (E15.5), the proximal-distal axis of polarity (arrows) in RVs is rotated in the P4 kidney. This is demonstrated by the expression patterns of Dll1 (distal RV) in renal vesicles at E15.5 and P4. This rotated axis of polarity in the P4 kidney is also seen in S-shaped bodies, where Dll1 expression is restricted to a small region within the medial SSB. Ureteric tips (black), nephrons (blue) and the outer edge of the kidney (red) are outlined. Loss of the cap mesenchyme together with the rotated location of the nephrons places them closer to the edge of the kidney at P4. D, distal; P, proximal; M, medial.
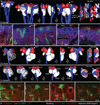
Figure 6. 3D modeling of the nephrogenic zone in the immediate postnatal period
Immunofluorescent labeling of serially sectioned P2 kidneys using antibodies to Collagen IV (basement membrane, red) and CalbindinD28K (ureteric tree, green) was used to model in 3D the spatial relationships between the ureteric tree and nephrons. 3D models (a, g, h) are shown above representative sections (b–f, i–l) and ureteric tree (blue), renal vesicles (red) and older nephron structures (white) have been modeled. Individual nephrons are numbered. Two regions of P2 nephrogenic zone are shown. In model 1 (a) 4 terminal ureteric tree branches and their associated nephrons were modeled. Model 1a (g) is a subset of Model 1 showing a single ureteric tree terminal branch, one tip is associated with 3 nephrons, the other tip with 4. In model 2 (h), a single terminal branch is shown, with 5 nephrons attached (2 RVs, 3 SSBs). One of these nephrons (SSB4) is attached to the ureteric epithelium below the other nephrons which are attached to the terminal of the ureteric tip (h, l). Altered UT morphology is seen as a thinning at the UT ends (see yellow arrows in top view of models (a, h) and IF (e, i) images). RV, renal vesicle; SSB, S-shaped body; CLN, capillary loop nephron. Movies of the 3D models are available as Supplementary Movie files; Movie 1 (model 1), Movie 2 (model 1a), Movie 3 (model 2).
Figure 7. Changes to postnatal ureteric tip morphology as multiple nephrons attach to each tip
(a–d) OPT of P0 and P2 ureteric epithelium performed on kidneys immunofluorescently-labeled with anti-CalbindinD28K antibody. Scale bars a & c = 20 µm; b & d = 100µm. (e–g) Serial thin (4µm) sections of an area of P2 nephrogenic zone stained with toluidine blue. The series shown here demonstrates 3 nephrons (labeled 1–3) attached to the same terminal branch of the ureteric tree (UB), including two S-shaped bodies (1, 2) located at the surface of the kidney and attached to the terminal of the ureteric tip, and a nephron at the capillary loop stage (3) located underneath nephrons 1 and 2 and attached to the ureteric epithelium below the tip terminal. Scale bar = 30µm.
Figure 8. Quantitative temporal analysis of cellular proliferation in the cap mesenchyme
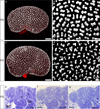
(a–d) Co-immunofluorescence for Six2 (red, CM), CalbindinD28K (green, UB), pHH3 (white, mitosing cells) and DAPI (blue, nuclei) of kidney sections (a) utilized for spot detection of pHH3+ (b), Six2+ (c) and pHH3+/Six2+ cells (d) performed using spot counting algorithms in BitPlane Imaris. (e) Quantitation of CM/tip and percentage of CM cells undergoing mitosis from E15.5 to P2.
Figure 9. Summary of spatial and molecular changes across the cessation of nephrogenesis
This schematic illustrates the location and spatial arrangement of the cap mesenchyme (green), ureteric tip (orange) and nephron (blue) compartments within the nephrogenic zone at E15.5 and P0-4. A top view and side view are shown for each age. At E15.5, cap mesenchyme is present surrounding each ureteric tip. As nephrogenesis ceases the cap mesenchyme is lost (absent at P4), at which time nephron and tree epithelia are located very close to the edge of the kidney. The molecular identity of the ureteric tip is maintained (yellow) after markers of the cap mesenchyme are lost. Molecular polarity in the early nephron occurs with respect to the position of the adjacent ureteric tip. At E15.5, distal-proximal nephron polarity in the kidney is indicated (arrows) and occurs in this orientation as nephrons develop in a specific location, underneath the ureteric tips (in the ‘armpit’ of the terminal branches of the ureteric tree). As the cap is lost, new nephrons are formed at the sides of the tip ends and nephron polarity is rotated in the kidney (arrows in P4) as the position of the new nephrons changes. At E15.5, each tip induces the formation of one nephron, postnatally as the cap differentiates into nephrons, multiple nephrons are seen attached to a single tip and at P2, up to 5 nephrons are seen associated with each tip (see top view P4). From P2-4, older nephrons can be seen attached to the ureteric epithelium below younger nephrons attached to the tip ends (arrowheads in P2-4).
Similar articles
- Analysis of early nephron patterning reveals a role for distal RV proliferation in fusion to the ureteric tip via a cap mesenchyme-derived connecting segment.
Georgas K, Rumballe B, Valerius MT, Chiu HS, Thiagarajan RD, Lesieur E, Aronow BJ, Brunskill EW, Combes AN, Tang D, Taylor D, Grimmond SM, Potter SS, McMahon AP, Little MH. Georgas K, et al. Dev Biol. 2009 Aug 15;332(2):273-86. doi: 10.1016/j.ydbio.2009.05.578. Epub 2009 Jun 6. Dev Biol. 2009. PMID: 19501082 - Cessation of renal morphogenesis in mice.
Hartman HA, Lai HL, Patterson LT. Hartman HA, et al. Dev Biol. 2007 Oct 15;310(2):379-87. doi: 10.1016/j.ydbio.2007.08.021. Epub 2007 Aug 16. Dev Biol. 2007. PMID: 17826763 Free PMC article. - Osr1 acts downstream of and interacts synergistically with Six2 to maintain nephron progenitor cells during kidney organogenesis.
Xu J, Liu H, Park JS, Lan Y, Jiang R. Xu J, et al. Development. 2014 Apr;141(7):1442-52. doi: 10.1242/dev.103283. Epub 2014 Mar 5. Development. 2014. PMID: 24598167 Free PMC article. - Defining and redefining the nephron progenitor population.
Hendry C, Rumballe B, Moritz K, Little MH. Hendry C, et al. Pediatr Nephrol. 2011 Sep;26(9):1395-406. doi: 10.1007/s00467-010-1750-4. Epub 2011 Jan 14. Pediatr Nephrol. 2011. PMID: 21229268 Free PMC article. Review. - Epigenetic States of nephron progenitors and epithelial differentiation.
Adli M, Parlak M, Li Y, El-Dahr SS. Adli M, et al. J Cell Biochem. 2015 Jun;116(6):893-902. doi: 10.1002/jcb.25048. J Cell Biochem. 2015. PMID: 25560433 Free PMC article. Review.
Cited by
- Embryonic Kidney Development, Stem Cells and the Origin of Wilms Tumor.
Li H, Hohenstein P, Kuure S. Li H, et al. Genes (Basel). 2021 Feb 23;12(2):318. doi: 10.3390/genes12020318. Genes (Basel). 2021. PMID: 33672414 Free PMC article. Review. - Progenitor translatome changes coordinated by Tsc1 increase perception of Wnt signals to end nephrogenesis.
Jarmas AE, Brunskill EW, Chaturvedi P, Salomonis N, Kopan R. Jarmas AE, et al. Nat Commun. 2021 Nov 3;12(1):6332. doi: 10.1038/s41467-021-26626-9. Nat Commun. 2021. PMID: 34732708 Free PMC article. - Conserved and Divergent Features of Human and Mouse Kidney Organogenesis.
Lindström NO, McMahon JA, Guo J, Tran T, Guo Q, Rutledge E, Parvez RK, Saribekyan G, Schuler RE, Liao C, Kim AD, Abdelhalim A, Ruffins SW, Thornton ME, Baskin L, Grubbs B, Kesselman C, McMahon AP. Lindström NO, et al. J Am Soc Nephrol. 2018 Mar;29(3):785-805. doi: 10.1681/ASN.2017080887. Epub 2018 Feb 15. J Am Soc Nephrol. 2018. PMID: 29449453 Free PMC article. - Slit2-Robo Signaling Promotes Glomerular Vascularization and Nephron Development.
Li J, Geraldo LH, Dubrac A, Zarkada G, Eichmann A. Li J, et al. J Am Soc Nephrol. 2021 Sep;32(9):2255-2272. doi: 10.1681/ASN.2020111640. Epub 2021 Aug 2. J Am Soc Nephrol. 2021. PMID: 34341180 Free PMC article. - Differential regulation of mouse and human nephron progenitors by the Six family of transcriptional regulators.
O'Brien LL, Guo Q, Lee Y, Tran T, Benazet JD, Whitney PH, Valouev A, McMahon AP. O'Brien LL, et al. Development. 2016 Feb 15;143(4):595-608. doi: 10.1242/dev.127175. Development. 2016. PMID: 26884396 Free PMC article.
References
- Boyle S, Misfeldt A, Chandler KJ, Deal KK, Southard-Smith EM, Mortlock DP, Baldwin HS, de Caestecker M. Fate mapping using Cited1-CreERT2 mice demonstrates that the cap mesenchyme contains self-renewing progenitor cells and gives rise exclusively to nephronic epithelia. Dev Biol. 2008;313(1):234–245. - PMC - PubMed
- Brenner BM, Anderson S. The interrelationships among filtration surface area, blood pressure, and chronic renal disease. J Cardiovasc Pharmacol. 1992;6(19 Suppl):S1–7. - PubMed
- Carroll TJ, Park JS, Hayashi S, Majumdar A, McMahon AP. Wnt9b plays a central role in the regulation of mesenchymal to epithelial transitions underlying organogenesis of the mammalian urogenital system. Dev Cell. 2005;9:283–292. - PubMed
Publication types
MeSH terms
Substances
LinkOut - more resources
Full Text Sources
Other Literature Sources
Molecular Biology Databases
Miscellaneous

