Fast-acting and nearly gratuitous induction of gene expression and protein depletion in Saccharomyces cerevisiae - PubMed (original) (raw)
Fast-acting and nearly gratuitous induction of gene expression and protein depletion in Saccharomyces cerevisiae
R Scott McIsaac et al. Mol Biol Cell. 2011 Nov.
Abstract
We describe the development and characterization of a system that allows the rapid and specific induction of individual genes in the yeast Saccharomyces cerevisiae without changes in nutrients or temperature. The system is based on the chimeric transcriptional activator Gal4dbd.ER.VP16 (GEV). Upon addition of the hormone β-estradiol, cytoplasmic GEV localizes to the nucleus and binds to promoters containing Gal4p consensus binding sequences to activate transcription. With galactokinase Gal1p and transcriptional activator Gal4p absent, the system is fast-acting, resulting in readily detectable transcription within 5 min after addition of the inducer. β-Estradiol is nearly a gratuitous inducer, as indicated by genome-wide profiling that shows unintended induction (by GEV) of only a few dozen genes. Response to inducer is graded: intermediate concentrations of inducer result in production of intermediate levels of product protein in all cells. We present data illustrating several applications of this system, including a modification of the regulated degron method, which allows rapid and specific degradation of a specific protein upon addition of β-estradiol. These gene induction and protein degradation systems provide important tools for studying the dynamics and functional relationships of genes and their respective regulatory networks.
Figures
FIGURE 1:
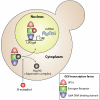
Schematic of the GEV overexpression system. GEV is constitutively expressed from an ACT1 promoter. Before activation by β-estradiol, GEV is inactive in the cytoplasm, associating with the Hsp90 chaperone complex. β-Estradiol diffuses through the cell membrane and binds to the GEV estrogen receptor domain, resulting in release of GEV from the Hsp90 chaperone complex. GEV then localizes to the nucleus, binds to the UASGAL consensus sequences, and strongly activates transcription through its VP16 domain.
FIGURE 2:
Single-cell analyses of a GEV-GFP fusion protein. (A) Measuring nuclear localization of GEV-GFP in the presence of different amounts of β-estradiol in DBY11415. (B) DBY11415 was grown in the presence of 1 μM β-estradiol for 50 min. The input medium was then switched to medium lacking β-estradiol, and the kinetics of delocalization were quantified. (C) Images of single cells from the washout experiment in (B). For each cell, the localization score is defined as the mean of the top 5% of pixel intensities minus the mean pixel intensity over the entire cell.
FIGURE 3:
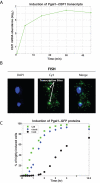
The kinetics of GEV-mediated genetic switch. (A) We followed transcription of P_GAL1_-CBF1 induced by GEV by microarray (strain = DBY12040), with DBY12001 RNA as a reference. Values are zero-normalized. (B) Maximal projection image of CBF1 transcripts from DBY12040 8 min after β-estradiol addition to the medium (FISH). Active transcription sites of P_GAL1_-CBF1 can be seen in single cells. (C) GEV activation of a P_GAL1_-GFP reporter in DBY12039 as measured by flow cytometry.
FIGURE 4:
GEV activity shows a graded response in response to β-estradiol. (A) Flow cytometry data at different doses of β-estradiol. Cells were grown to mid-log phase and incubated with the indicated amount of β-estradiol for 12 h. (B) The mean GFP intensity from histograms in (A) as a function of β-estradiol dose. The Hill coefficient (nH) is 0.95 (95% CI, nH = 0.72 to 1.18). The strain used in this experiment is DBY12039.
FIGURE 5:
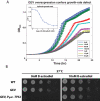
GEV is a gratuitous inducer at 10 nM β-estradiol without a growth defect. (A) DBY12021 grown in YPD liquid in the presence of β-estradiol. A600 was monitored over time, and growth rates were spline-fit (inset). Error bars represent ±1 SD of three replicates. (B) The heat sensitivity of tps2Δ is repaired by GEV-mediated induction of TPS2 with 10 nM β-estradiol. (WT = DBY12001; GEV = DBY12021; GEV + PGAL1-TPS2 = DBY12086).
FIGURE 6:
(A) Hierarchical clustering of gene expression of DBY12021 grown to steady state in a phosphate-limited chemostat with a doubling time of 4.3 h, and at t = 0 min, pulsed with 1 μM β-estradiol. (B) The transcriptional response of the GAL genes from (A). (C) Transcriptional response of YPL066W and YPL067C in (A). (D) The 10 most strongly repressed genes in (A). Clusters in (B) and (D) were hierarchically clustered.
FIGURE 7:
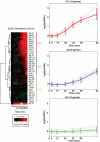
Quantifying the kinetics of MET4's downstream targets. DBY12027 (GEV, P_GAL1_-MET4) was grown to steady state in a phosphate-limited chemostat with excess methionine (200 mg/l) with a doubling time of 4.3 h. At t = 0 min, cells were pulsed with 1 μM β-estradiol. Left, hierarchical clustering of the sulfur metabolic genes with three clearly identifiable categories based on kinetics. Right, the mean expression of genes in each category is plotted (color) along with individual traces (gray). Error bars represent ±1 SD of the mean.
FIGURE 8:
(A) GEV is expressed under the regulation of the constitutive ACT1 promoter. Treatment with β-estradiol induces nuclear entry of GEV and subsequent induction of P_GAL1_-driven TEV. (B) The target gene of interest (YFG) is regulated by its native promoter. TEV protease binding to its cleavage site in NDeg-modified YFG, facilitated by p14-SF3b binding, results in cleavage, exposing the destabilizing amino acid phenylalanine at the N-terminus. Proteasome-mediated digestion of YFG is the result of N-end rule degradation pathway.
FIGURE 9:
(A) Western blot of DBY12055 (NDeg-Met4p-13Myc) and DBY11440 (Met4p-13Myc) before (0′) and after (10′, 20′, and 40′) 1 μM β-estradiol addition to the culture. (B) Western blot of DBY12234 (NDeg-Met31p-13Myc) and DBY12235 (Met31p-13Myc) before (0′) and after (10′, 20′, and 40′) 1 μM β-estradiol addition to the culture. (C) Normalized protein levels from experiments in (A) and (B) with DBY12055 and DBY12199. Protein levels were quantified in ImageJ and then fitted to a power law for the 10′, 20′, and 40′ time points.
Similar articles
- Interplay of a ligand sensor and an enzyme in controlling expression of the Saccharomyces cerevisiae GAL genes.
Abramczyk D, Holden S, Page CJ, Reece RJ. Abramczyk D, et al. Eukaryot Cell. 2012 Mar;11(3):334-42. doi: 10.1128/EC.05294-11. Epub 2011 Dec 30. Eukaryot Cell. 2012. PMID: 22210830 Free PMC article. - Activation of Gal4p by galactose-dependent interaction of galactokinase and Gal80p.
Zenke FT, Engles R, Vollenbroich V, Meyer J, Hollenberg CP, Breunig KD. Zenke FT, et al. Science. 1996 Jun 14;272(5268):1662-5. doi: 10.1126/science.272.5268.1662. Science. 1996. PMID: 8658143 - The regulatory roles of the galactose permease and kinase in the induction response of the GAL network in Saccharomyces cerevisiae.
Hawkins KM, Smolke CD. Hawkins KM, et al. J Biol Chem. 2006 May 12;281(19):13485-13492. doi: 10.1074/jbc.M512317200. Epub 2006 Mar 7. J Biol Chem. 2006. PMID: 16524886 - Transcriptional control of the GAL/MEL regulon of yeast Saccharomyces cerevisiae: mechanism of galactose-mediated signal transduction.
Bhat PJ, Murthy TV. Bhat PJ, et al. Mol Microbiol. 2001 Jun;40(5):1059-66. doi: 10.1046/j.1365-2958.2001.02421.x. Mol Microbiol. 2001. PMID: 11401712 Review. - Genome-wide analysis of the context-dependence of regulatory networks.
Papp B, Oliver S. Papp B, et al. Genome Biol. 2005;6(2):206. doi: 10.1186/gb-2005-6-2-206. Epub 2005 Jan 27. Genome Biol. 2005. PMID: 15693953 Free PMC article. Review.
Cited by
- ADP-ribosylation of translation elongation factor 2 by diphtheria toxin in yeast inhibits translation and cell separation.
Mateyak MK, Kinzy TG. Mateyak MK, et al. J Biol Chem. 2013 Aug 23;288(34):24647-55. doi: 10.1074/jbc.M113.488783. Epub 2013 Jul 12. J Biol Chem. 2013. PMID: 23853096 Free PMC article. - Genome-scale reconstruction of Gcn4/ATF4 networks driving a growth program.
Srinivasan R, Walvekar AS, Rashida Z, Seshasayee A, Laxman S. Srinivasan R, et al. PLoS Genet. 2020 Dec 30;16(12):e1009252. doi: 10.1371/journal.pgen.1009252. eCollection 2020 Dec. PLoS Genet. 2020. PMID: 33378328 Free PMC article. - Catalytically inactive Cas9 impairs DNA replication fork progression to induce focal genomic instability.
Doi G, Okada S, Yasukawa T, Sugiyama Y, Bala S, Miyazaki S, Kang D, Ito T. Doi G, et al. Nucleic Acids Res. 2021 Jan 25;49(2):954-968. doi: 10.1093/nar/gkaa1241. Nucleic Acids Res. 2021. PMID: 33398345 Free PMC article. - A Toolkit for Precise, Multigene Control in Saccharomyces cerevisiae.
Sanford A, Kiriakov S, Khalil AS. Sanford A, et al. ACS Synth Biol. 2022 Dec 16;11(12):3912-3920. doi: 10.1021/acssynbio.2c00423. Epub 2022 Nov 11. ACS Synth Biol. 2022. PMID: 36367334 Free PMC article. - Cellular processing of beneficial de novo emerging proteins.
Houghton CJ, Coelho NC, Chiang A, Hedayati S, Parikh SB, Ozbaki-Yagan N, Wacholder A, Iannotta J, Berger A, Carvunis AR, O'Donnell AF. Houghton CJ, et al. bioRxiv [Preprint]. 2024 Aug 29:2024.08.28.610198. doi: 10.1101/2024.08.28.610198. bioRxiv. 2024. PMID: 39257767 Free PMC article. Preprint.
References
- Bachmair A, Finley D, Varshavsky A. In vivo half-life of a protein is a function of its amino-terminal residue. Science. 1986;234:179–186. - PubMed
Publication types
MeSH terms
Substances
Grants and funding
- R01 GM046406/GM/NIGMS NIH HHS/United States
- P50 GM071508/GM/NIGMS NIH HHS/United States
- GM046406/GM/NIGMS NIH HHS/United States
- T32 CA009528/CA/NCI NIH HHS/United States
- GM071508/GM/NIGMS NIH HHS/United States
- R37 GM046406/GM/NIGMS NIH HHS/United States
- T32 CA 009528-24/CA/NCI NIH HHS/United States
LinkOut - more resources
Full Text Sources
Other Literature Sources
Molecular Biology Databases


