Inference of relationships in population data using identity-by-descent and identity-by-state - PubMed (original) (raw)
Inference of relationships in population data using identity-by-descent and identity-by-state
Eric L Stevens et al. PLoS Genet. 2011 Sep.
Abstract
It is an assumption of large, population-based datasets that samples are annotated accurately whether they correspond to known relationships or unrelated individuals. These annotations are key for a broad range of genetics applications. While many methods are available to assess relatedness that involve estimates of identity-by-descent (IBD) and/or identity-by-state (IBS) allele-sharing proportions, we developed a novel approach that estimates IBD0, 1, and 2 based on observed IBS within windows. When combined with genome-wide IBS information, it provides an intuitive and practical graphical approach with the capacity to analyze datasets with thousands of samples without prior information about relatedness between individuals or haplotypes. We applied the method to a commonly used Human Variation Panel consisting of 400 nominally unrelated individuals. Surprisingly, we identified identical, parent-child, and full-sibling relationships and reconstructed pedigrees. In two instances non-sibling pairs of individuals in these pedigrees had unexpected IBD2 levels, as well as multiple regions of homozygosity, implying inbreeding. This combined method allowed us to distinguish related individuals from those having atypical heterozygosity rates and determine which individuals were outliers with respect to their designated population. Additionally, it becomes increasingly difficult to identify distant relatedness using genome-wide IBS methods alone. However, our IBD method further identified distant relatedness between individuals within populations, supported by the presence of megabase-scale regions lacking IBS0 across individual chromosomes. We benchmarked our approach against the hidden Markov model of a leading software package (PLINK), showing improved calling of distantly related individuals, and we validated it using a known pedigree from a clinical study. The application of this approach could improve genome-wide association, linkage, heterozygosity, and other population genomics studies that rely on SNP genotype data.
Conflict of interest statement
TJD is an employee and stockholder of Partek. GH is an employee of Partek.
Figures
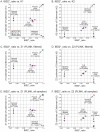
Figure 1. Genetic relatedness plots of the Human Variation Panel genotype data.
Abbreviations: AA, African American; CAU, Caucasian; CHI, Chinese; MEX, Mexican. (A) IBS2* plot of the within-group comparisons (n = 19,800). The IBS2*_ratio values are centered on 2/3 for unrelated individuals within a population. The relationship of NA17251 to 99 other AA individuals is indicated (arrow). A group of 9 MEX individuals have atypically low heterozygosity rates and form a cluster separated from other within-MEX comparisons (arrow 1). (B) IBS2* plot in which pairwise comparisons with IBS2*_ratio values >0.8 are removed (n = 13) and data points are colored by the sum of autosomal heterozygosity of each pair of individuals. (C) IBS2* plot for between-group comparisons (n = 60,000) for which none are expected to be genetically related. For groups having individuals with large differences in heterozygosity rates, such as AA-CHI comparisons, the IBS2*_ratio values are significantly lower than 2/3. The MEX individuals with atypical heterozygosity rates tend to form outlier clusters in between-group comparisons such as AA-MEX (arrow 1) and CHI-MEX (arrow 2). A group of five pairwise comparisons having relatively high IBS2*_ratio values (0.685 to 0.692; arrow 3) involve MEX individual NA17709 in comparison to CAU individuals.
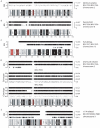
Figure 2. Visualization of shared chromosomal regions based on IBS for related individuals.
IBS values for comparisons of two individuals are shown for a representative chromosome for the following pairs: (A) replicate samples NA17255/NA17263, (B) parent-child NA17624/NA17626, (C) full siblings NA17671/NA17674, (D) individuals sharing one quarter of their alleles (NA17655/NA17656; e.g. half-siblings), (E) distantly related individuals NA17673/NA17680. Data analysis was performed using SNPduo software. Note that for pericentromeric regions and the short arms of acrocentric chromosomes (as in panel C) no SNP data were available, producing no IBS measurements.
Figure 3. Relationship of IBS2* values to IBD estimates for recently related within-group comparisons.
IBS2* plots for recently related within-group comparisons having IBS2*_ratio values >0.80. The y-axis shows IBD1 and IBD2 estimates derived from our approach (K1, panel A; K2, panel B), PLINK's HMM which had removed individuals due to low genotyping rates (Z1, panel C; Z2, panel D), and PLINK's HMM with the same quality control metrics except that no individuals were removed (Z1, panel E; Z2, panel F). Note that the x-axis and y-axis scales are the same for panels A–F. Arrows and brackets indicate groups of pairwise comparisons representing one relationship type (see text for details). Colors correspond to ethnic group and are matched across the four panels.
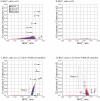
Figure 4. Relationship of IBS2* values to IBD estimates for distantly related within-group comparisons.
IBS2* plots for within-group comparisons having IBS2*_ratio values <0.76 are shown. The y-axis shows IBD1 and IBD2 estimates derived from our approach (panels A, B) and PLINK's HMM which had removed individuals due to low genotype rates (panels C, D). Note that the x-axes scales are the same for all panels, and the y-axes are comparable for panels A, C and B, D. Arrows indicate pairwise comparisons: arrow 1, NA17673/NA17680 (MEX; see also arrow 1 in Figure 1A, 1B); arrow 2, NA17454/NA17459 (MEX; see also arrow 1 in Figure 1A, 1B); arrow 3, NA17203/NA17257 (CAU); arrow 4, NA17289/NA17299 (CAU); arrow 5, NA17785/NA17794 (CHI).
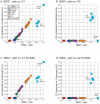
Figure 5. Validation of IBS2* methodology using annotated relationships from a known pedigree.
IBS2* plot analysis of real data from a large pedigree annotated by distance (i.e. proportion of IBD). The y-axis shows IBD1 and IBD2 estimates derived from our approach (panels A, C) and PLINK's HMM (panels B, D). These distances refer to Cotterman coefficients of relatedness. Note the linear relationship between K1and Z1 and IBS2*_ratio values in panels A and C.
Similar articles
- Consanguinity in Centre d'Étude du Polymorphisme Humain (CEPH) pedigrees.
Stevens EL, Heckenberg G, Baugher JD, Roberson ED, Downey TJ, Pevsner J. Stevens EL, et al. Eur J Hum Genet. 2012 Jun;20(6):657-67. doi: 10.1038/ejhg.2011.266. Epub 2012 Jan 25. Eur J Hum Genet. 2012. PMID: 22274586 Free PMC article. - Unexpected relationships and inbreeding in HapMap phase III populations.
Stevens EL, Baugher JD, Shirley MD, Frelin LP, Pevsner J. Stevens EL, et al. PLoS One. 2012;7(11):e49575. doi: 10.1371/journal.pone.0049575. Epub 2012 Nov 19. PLoS One. 2012. PMID: 23185369 Free PMC article. - A method for detecting IBD regions simultaneously in multiple individuals--with applications to disease genetics.
Moltke I, Albrechtsen A, Hansen TV, Nielsen FC, Nielsen R. Moltke I, et al. Genome Res. 2011 Jul;21(7):1168-80. doi: 10.1101/gr.115360.110. Epub 2011 Apr 14. Genome Res. 2011. PMID: 21493780 Free PMC article. - Identity by descent between distant relatives: detection and applications.
Browning SR, Browning BL. Browning SR, et al. Annu Rev Genet. 2012;46:617-33. doi: 10.1146/annurev-genet-110711-155534. Epub 2012 Sep 17. Annu Rev Genet. 2012. PMID: 22994355 Review. - Current Developments in Detection of Identity-by-Descent Methods and Applications.
Sticca EL, Belbin GM, Gignoux CR. Sticca EL, et al. Front Genet. 2021 Sep 10;12:722602. doi: 10.3389/fgene.2021.722602. eCollection 2021. Front Genet. 2021. PMID: 34567074 Free PMC article. Review.
Cited by
- Consanguinity in Centre d'Étude du Polymorphisme Humain (CEPH) pedigrees.
Stevens EL, Heckenberg G, Baugher JD, Roberson ED, Downey TJ, Pevsner J. Stevens EL, et al. Eur J Hum Genet. 2012 Jun;20(6):657-67. doi: 10.1038/ejhg.2011.266. Epub 2012 Jan 25. Eur J Hum Genet. 2012. PMID: 22274586 Free PMC article. - Genomics-assisted characterization of a breeding collection of Apios americana, an edible tuberous legume.
Belamkar V, Farmer AD, Weeks NT, Kalberer SR, Blackmon WJ, Cannon SB. Belamkar V, et al. Sci Rep. 2016 Oct 10;6:34908. doi: 10.1038/srep34908. Sci Rep. 2016. PMID: 27721469 Free PMC article. - Identifying large sets of unrelated individuals and unrelated markers.
Abraham KJ, Diaz C. Abraham KJ, et al. Source Code Biol Med. 2014 Mar 17;9(1):6. doi: 10.1186/1751-0473-9-6. Source Code Biol Med. 2014. PMID: 24635884 Free PMC article. - Spatial heterogeneity as a genetic mixing mechanism in highly philopatric colonial seabirds.
Cristofari R, Trucchi E, Whittington JD, Vigetta S, Gachot-Neveu H, Stenseth NC, Le Maho Y, Le Bohec C. Cristofari R, et al. PLoS One. 2015 Feb 13;10(2):e0117981. doi: 10.1371/journal.pone.0117981. eCollection 2015. PLoS One. 2015. PMID: 25680103 Free PMC article. - Familial identification: population structure and relationship distinguishability.
Rohlfs RV, Fullerton SM, Weir BS. Rohlfs RV, et al. PLoS Genet. 2012 Feb;8(2):e1002469. doi: 10.1371/journal.pgen.1002469. Epub 2012 Feb 9. PLoS Genet. 2012. PMID: 22346758 Free PMC article.
References
- Lee W. Testing the genetic relation between two individuals using a panel of frequency-unknown single nucleotide polymorphisms. Ann Hum Genet. 2003:618–619. - PubMed
- Rosenberg NA. Standardized subsets of the HGDP-CEPH Human Genome Diversity Cell Line Panel, accounting for atypical and duplicated samples and pairs of close relatives. Ann Hum Genet. 2006;70:841–847. - PubMed
- Cotterman C. A calculus for statistico-genetics: Ohio State University 1940
Publication types
MeSH terms
LinkOut - more resources
Full Text Sources
Other Literature Sources


