FAK is required for the assembly of podosome rosettes - PubMed (original) (raw)
FAK is required for the assembly of podosome rosettes
Yi-Ru Pan et al. J Cell Biol. 2011.
Abstract
Podosomes are dynamic actin-enriched membrane structures that play an important role in invasive cell motility and extracellular matrix degradation. They are often found to assemble into large rosettelike structures in highly invasive cells. However, the mechanism of this assembly remains obscure. In this study, we identified focal adhesion kinase (FAK) as a key molecule necessary for assembly. Moreover, phosphorylation of p130Cas and suppression of Rho signaling by FAK were found to be important for FAK to induce the assembly of podosome rosettes. Finally, we found that suppression of vimentin intermediate filaments by FAK facilitates the assembly of podosome rosettes. Collectively, our results strongly suggest a link between FAK, podosome rosettes, and tumor invasion and unveil a negative role for Rho signaling and vimentin filaments in podosome rosette assembly.
Figures
Figure 1.
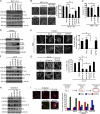
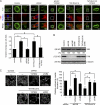
FAK is crucial for podosome rosette assembly in various types of cells. (A) shRNAs specific to FAK (shFAK; clones #1 and #2), PYK2 (shPYK2), or luciferase (shLuc) were stably expressed in v-Src–transformed MEFs. HA-FAK resistant to shFAK was reexpressed into the cells expressing shFAK#1 (shFAK#1/HA-FAK). An equal amount of whole-cell lysates was analyzed by immunoblotting with the indicated antibodies. (B) The cells were stained for F-actin. The percentage of the cells containing podosome rosettes in the total counted cells (n ≥ 300) was determined. (C) The cells were subjected to a Matrigel invasion assay. Data were quantified and expressed as a percentage relative to the level of the control. (D) HUVECs and those expressing shRNAs were analyzed by immunoblotting. A monoclonal anti-PYK2 (mAb) and a polyclonal anti-PYK2 (pAb) were used to detect PYK2. (E) The cells were treated with (+) or without (−) 100 nM PMA for 3 h and stained for F-actin. Arrows indicate podosome rosettes. The percentage of the cells containing podosome rosettes in the total counted cells (n ≥ 300) was determined. (F) shRNAs specific to FAK (clones #1 and #2), PYK2, or luciferase were stably expressed in CL1-5 cells. HA-FAK resistant to shFAK was reexpressed into the cells expressing shFAK #1. Whole-cell lysates were analyzed by immunoblotting with the indicated antibodies. (G) The cells were stained for F-actin, and the percentage of the cells containing podosome rosettes in the total counted cells (n ≥ 300) was determined. (H) Cell lysates from RAW264.7 cells and those expressing shRNAs were analyzed by immunoblotting with the indicated antibodies. (I) The cells were treated with 100 ng/ml GST-RANKL for 7 d and stained for F-actin and nuclei. Cells containing more than three nuclei were defined as osteoclasts. The percentage of the osteoclasts containing podosome clusters, rings, or belts in the total counted osteoclasts (n ≥ 100) was determined. (B, C, E, G, and I) Values (means ± SD) are from three independent experiments. *, P < 0.005.
Figure 2.
FAK is dispensable for the formation of dot-shaped podosomes but is essential for the assembly of podosome rosettes. (A) Whole-cell lysates from FAK+/+ MEFs, FAK−/− MEFs, and those transformed by v-Src were analyzed by immunoblotting with the indicated antibodies. (B) The percentage of the cells with dot-shaped podosomes and podosome rosettes in the total counted cells (n ≥ 300) was determined. (C) The cells were stained for F-actin and cortactin. Representative high-power images are shown. Arrows indicate podosome rosettes. Arrowheads indicate dot-shaped podosomes. (D) v-Src–transformed MEFs were seeded on Alexa Fluor 488–conjugated fibronectin (FN) for 24 h and then stained for F-actin. The z stack images were obtained and reconstituted by confocal microscopy. The XY and XZ sections of the boxed areas are shown. Left, dot-shaped podosomes; right, podosome rosettes. (E) The cells were seeded on Alexa Fluor 488–conjugated fibronectin for 24 h and then stained for F-actin and nuclei. Arrowheads indicate the areas in which fibronectin was degraded by dot-shaped podosomes. Arrows indicate the areas in which fibronectin was degraded by podosome rosettes. The areas in which fibronectin had been degraded were measured and expressed as fold relative to the level of FAK+/+ MEFs. (F) Matrigel invasion assay. (B, E, and F) Values (means ± SD) are from three independent experiments. *, P < 0.005. (G) An equal amount of whole-cell lysates was analyzed for MMP expression by immunoblotting.
Figure 3.
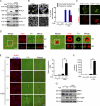
Increased expression of FAK is correlated with increases in podosome rosette formation, matrix degradation, and cell invasion. (A) An inducible (Tet-Off) expression system for wt FAK expression was established in v-Src–transformed FAK−/− MEFs (Tet FAK wt/v-Src). Three cell clones (#2, #7, and #12) were selected and maintained in the medium with (+) tetracycline. The cells were allowed to express FAK upon tetracycline withdrawal (−). 24 h after tetracycline withdrawal, FAK expression was analyzed by immunoblotting. The expression level of FAK was quantified and expressed as fold relative to the level of clone #2. (B) Three FAK-inducible clones and a control clone (tetracycline-controlled transactivator [t-TA]) that encodes t-TA were grown in the medium with or without tetracycline for 24 h and were then stained for F-actin. Arrows indicate podosome rosettes. The percentage of the cells containing podosome rosettes in the total counted cells (n ≥ 300) was determined. #, P < 0.05. (C) The cells were grown in the medium with or without tetracycline for 24 h and were plated on Alexa Fluor 488–conjugated fibronectin (FN) for another 24 h. The areas in which fibronectin was degraded were measured and expressed as fold relative to the area degraded by clone #2 in the presence of tetracycline. #, P < 0.05. (D) The cells were grown in the medium with or without tetracycline for 24 h and were then subjected to a Matrigel invasion assay. Data were quantified and expressed as fold relative to the level of clone #2 in the presence of tetracycline. (B–D) Values (means ± SD) are from at least three independent experiments. *, P < 0.005.
Figure 4.
FAK is localized to podosome rosettes and some dot-shaped podosomes. (A and B) v-Src–transformed FAK+/+ MEFs were fixed and stained for F-actin, FAK, paxillin, and active Src (Src pY416). The z stack images were obtained and reconstituted by confocal microscopy. The XY and XZ sections of the boxed areas containing a podosome rosette are shown. (C) GFP, GFP-FAK, GFP-FAK-NH2 (GFP-FAK-N) domain, or GFP-FAK-COOH (GFP-FAK-C) domain was transiently expressed in Src-transformed 3T3 cells and then stained for F-actin. Arrows indicate podosome rosettes. Note that the GFP-FAK-NH2 domain is not localized to podosome rosettes. (D) v-Src–transformed MEFs were stained for F-actin, vinculin, and FAK. The representative image shows that FAK and vinculin are localized to dot-shaped podosomes. Arrows indicate dot-shaped podosomes that are enlarged and shown in the insets. (E) v-Src–transformed FAK+/+ MEFs were seeded on Alexa Fluor 488–conjugated fibronectin (FN) for 24 h and then stained for F-actin and FAK. Arrowheads indicate dot-shaped podosomes without FAK association. Arrows indicate dot-shaped podosomes with FAK association. Note that dot-shaped podosomes with FAK association have higher matrix-degrading activity than those without FAK association. (F) The cells were seeded on labeled fibronectin for 24 h. The mean degraded area by a dot-shaped podosome was measured (n = 15). Values (means ± SD) are from three independent experiments. *, P < 0.005.
Figure 5.
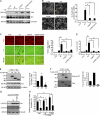
The Tyr-397 and catalytic activity of FAK are essential for the triggering of podosome rosette assembly. (A) An inducible (Tet-Off) expression system for FAK and its mutants was established in v-Src–transformed FAK−/− MEFs. The cells were maintained in the medium with (+) tetracycline. 24 h after tetracycline withdrawal (−), the cells were lysed and analyzed by immunoblotting. (B) The cells were grown in the absence of tetracycline for 24 h and stained for F-actin. Arrows indicate podosome rosettes. The percentage of the cells containing podosome rosettes in the total counted cells (n ≥ 300) was determined. (C) The cells were grown in the presence or absence of tetracycline for 24 h and were then subjected to a matrix degradation assay in the presence of tetracycline. Data were quantified and expressed as fold relative to the level of the t-TA clone in the presence of tetracycline. (D) The cells were grown in the presence or absence of tetracycline for 24 h and were then subjected to a Matrigel invasion assay. Data were quantified and expressed as fold relative to the level of the t-TA clone in the presence of tetracycline. (E) FLAG-FAK or its mutants with deletion at the NH2 domain (ΔN) or the COOH domain (ΔC) were stably expressed in v-Src–transformed FAK−/− MEFs. An equal amount of whole-cell lysates was analyzed by immunoblotting with the indicated antibodies. The formation of podosome rosettes was quantified and expressed as fold relative to that of the cells expressing FLAG-FAK wt. (F) The Y577 phosphorylation of FLAG-FAK was analyzed by immunoblotting. Data were normalized to the protein level and expressed as fold relative to the level of FAK wt. Values are the mean from two independent experiments. (G) Stable expression of T7-FAK and Y194E mutant in CL1-5 cells. (H) The cells were treated with or without PP2 at 10 µM for 1 h and stained for F-actin. The formation of podosome rosettes was quantified and expressed as a percentage relative to the control cells (neomycin) in the absence of PP2. (B–E and H) Values (means ± SD) are from three independent experiments. *, P < 0.005.
Figure 6.
Interaction of FAK with p130Cas is important for podosome rosette formation. (A) Stable expression of FLAG-FAK and its mutants in v-Src–transformed FAK−/− MEFs. KD, kinase-dead mutant. (B) The formation of podosome rosettes was quantified and expressed as a percentage relative to the cells expressing FLAG-FAK wt. (C) FAK was depleted in v-Src–transformed FAK+/+ MEFs by shRNA (shFAK). Subsequently, HA-FAK resistant to shFAK was stably reexpressed into the FAK-depleted cells (shFAK/HA-FAK). The tyrosine phosphorylation of p130Cas (Cas), cortactin, and Tks5 was analyzed. The tyrosine phosphorylation of p130Cas was quantified and expressed as a percentage relative to the level in the cells expressing shLuc. The results shown are representative of three experiments. (D) Immunoblotting for the p130Cas expression in v-Src–transformed MEFs and those expressing shRNAs specific to p130Cas (shCas) or luciferase (shLuc) as a control. (E) The cells were stained for F-actin, and the percentage of the cells containing podosome rosettes in the total counted cells (n ≥ 300) was determined. (F) T7-FAK Y194E or c-SrcY527F was transiently expressed in SYF cells, and the tyrosine phosphorylation of p130Cas (Cas pY) was analyzed. (G) GFP or GFP-p130Cas SH3 domain (GFP-Cas SH3) was transiently expressed in Src-transformed 3T3 cells. The cells were stained for F-actin, and the percentage of the cells containing podosome rosettes in the total counted cells expressing GFP or GFP-Cas SH3 (n ≥ 100) was determined. (B, E, and G) Values (means ± SD) are from three independent experiments. *, P < 0.005.
Figure 7.
Suppression of Rho signaling by FAK is crucial for podosome rosette assembly. (A) The levels of active (GTP-bound) Rho family proteins including RhoA, Rac1, and Cdc42 in the cells were measured. The results shown are representative of three experiments. (B) v-Src–transformed MEFs expressing shRNA to luciferase (shLuc) were treated with TAT-RhoV14 at various concentrations for 12 h. v-Src–transformed MEFs expressing shRNA to FAK (shFAK) were treated with TAT-C3 at various concentrations for 12 h. The formation of podosome rosettes was measured and expressed as a percentage relative to that of control cells expressing shLuc. *, P < 0.005 (compared with the shFAK cells without TAT-C3 treatment); #, P < 0.005 (compared with the shLuc cells without TAT-RhoV14 treatment). (C) Src-transformed 3T3 cells were stained for F-actin, p190RhoGAP (p190A), and FAK. The z stack images were obtained and reconstituted by confocal microscopy. The XY and XZ sections of the boxed area containing a podosome rosette are shown. (D) v-Src–transformed MEFs and those expressing shRNAs specific to FAK, p190RhoGAP (shp190A), or luciferase were analyzed for the expression of FAK and p190RhoGAP by immunoblotting. The level of active RhoA was measured. The formation of podosome rosettes was measured and expressed as a percentage relative to that of the control cells expressing shLuc. *, P < 0.005. (B and D) Values (means ± SD) are from three independent experiments. (E) The effect of p130Cas knockdown on Rho activity was analyzed. The level of active RhoA was measured, quantified, and expressed as fold relative to the control cells. The results shown are the representative of three experiments.
Figure 8.
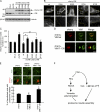
ROCK facilitates the disassembly of podosome rosettes. (A) v-Src–transformed FAK−/− and FAK+/+ MEFs were treated with (+) or without (−) the ROCK inhibitor Y27632 (10 µM) for 2 h. The percentage of the cells containing dot-shaped podosomes or podosome rosettes in the total counted cells (n ≥ 300) was determined. (B) v-Src–transformed FAK−/− MEFs were treated with or without 10 µM Y27632 for 2 h and stained for F-actin and cortactin. Representative high-power images are shown. (C) The cells were seeded on Alexa Fluor 488–conjugated fibronectin (FN) for 24 h and then treated with or without Y27632 for another 6 h. The areas in which fibronectin had been degraded were measured. Data are expressed as fold relative to the level of v-Src–transformed FAK−/− MEFs in the absence of Y27632. #, P < 0.05. (D) The cells were subjected to a Matrigel invasion assay in the presence or absence of 10 µM Y27632. Data are expressed as fold relative to the level of v-Src–transformed FAK−/− MEFs in the absence of Y27632. (A, C, and D) Values (means ± SD) are from at least three independent experiments. (E) v-Src–transformed FAK+/+ MEFs stably expressing mCherry-FAK and GFP-actin were monitored by time-lapse microscopy. Representative sequential images selected at different time points are shown. (F) v-Src–transformed FAK+/+ MEFs stably expressing mCherry-FAK and GFP-actin were monitored by time-lapse microscopy in the presence or absence of 10 µM Y27632. The duration (means ± SD) of the disassembly phase in the total counted podosome rosettes (n = 15) was determined. (A, C, D, and F) *, P < 0.005.
Figure 9.
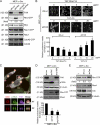
Suppression of vimentin filaments by FAK facilitates the assembly of podosome rosettes. (A) shRNAs specific to FAK (shFAK) or luciferase as a control were stably expressed in CL1-5 cells. The control cells were treated with 1 µg/ml TAT-RhoV14 for 12 h. In some cases, the cells were further treated with 10 µM Y27632. The cells were stained for F-actin, vimentin (VIM), and nuclei. The boxed areas from the images are enlarged. For the control cells, enlarged images from a podosome rosette (a) and the cell periphery (b) are shown. The fluorescent intensity of vimentin filaments per cell was measured (n = 30) and expressed as fold relative to the level of the control cells. (B) The CL1-5 cells expressing shFAK were transfected with duplex siRNA specific to vimentin (shFAK/siVIM). After 3 d, CL1-5 cells and those transfected with vimentin siRNA were treated with 1 µg/ml TAT-RhoV14 for 12 h. The expression of FAK and vimentin was analyzed by immunoblotting. (C) The cells were stained for F-actin. The formation of podosome rosettes was quantified. Values (means ± SD) are from three independent experiments. (A and C) *, P < 0.005; #, P < 0.05.
Figure 10.
Phosphorylation and polymerization of vimentin by ROCK antagonize the formation of podosome rosettes. (A) Vimentin was depleted in v-Src–transformed FAK+/+ MEFs by shRNA (shVIM). Subsequently, mCherry-vimentin (cherry-VIM) or its mutants were stably reexpressed in the vimentin-depleted cells (shVIM/cherry-VIM). The expression of vimentin was analyzed by immunoblotting. (B) The organization of mCherry-vimentin in the cells was visualized under a fluorescent microscope (DM LB; Leica). The boxed areas from the images are enlarged. The yellow dashed lines mark the outlines of the cells. (C) The formation of podosome rosettes was measured and expressed as a percentage relative to the control cells. (D) mCherry-vimentin or its NH2-terminal fragment (aa 1–138) was transiently expressed in Src-transformed 3T3 cells. The cells were stained for vimentin. (E) The percentage of the cells containing podosome rosettes in the total counted cells expressing mCherry proteins (n ≥ 100) was determined. (C and E) Values (means ± SD) are from three independent experiments. *, P < 0.005; #, P < 0.05. (F) A diagram illustrating that FAK may facilitate the assembly of podosome rosettes by promotion of p130Cas phosphorylation and suppression of the Rho-ROCK–vimentin pathway.
Similar articles
- Phosphorylation of moesin by Jun N-terminal kinase is important for podosome rosette formation in Src-transformed fibroblasts.
Pan YR, Tseng WS, Chang PW, Chen HC. Pan YR, et al. J Cell Sci. 2013 Dec 15;126(Pt 24):5670-80. doi: 10.1242/jcs.134361. Epub 2013 Oct 14. J Cell Sci. 2013. PMID: 24127566 - Invasive matrix degradation at focal adhesions occurs via protease recruitment by a FAK-p130Cas complex.
Wang Y, McNiven MA. Wang Y, et al. J Cell Biol. 2012 Feb 6;196(3):375-85. doi: 10.1083/jcb.201105153. Epub 2012 Jan 30. J Cell Biol. 2012. PMID: 22291036 Free PMC article. - Proteomic profiling of endothelial invasion revealed receptor for activated C kinase 1 (RACK1) complexed with vimentin to regulate focal adhesion kinase (FAK).
Dave JM, Kang H, Abbey CA, Maxwell SA, Bayless KJ. Dave JM, et al. J Biol Chem. 2013 Oct 18;288(42):30720-30733. doi: 10.1074/jbc.M113.512467. Epub 2013 Sep 4. J Biol Chem. 2013. PMID: 24005669 Free PMC article. - Palladin regulation of the actin structures needed for cancer invasion.
Najm P, El-Sibai M. Najm P, et al. Cell Adh Migr. 2014;8(1):29-35. doi: 10.4161/cam.28024. Epub 2013 Jan 1. Cell Adh Migr. 2014. PMID: 24525547 Free PMC article. Review. - Focal adhesion kinase and its potential involvement in tumor invasion and metastasis.
Kornberg LJ. Kornberg LJ. Head Neck. 1998 Dec;20(8):745-52. doi: 10.1002/(sici)1097-0347(199812)20:8<745::aid-hed14>3.0.co;2-z. Head Neck. 1998. PMID: 9790298 Review.
Cited by
- Biogenesis of podosome rosettes through fission.
Kuo SL, Chen CL, Pan YR, Chiu WT, Chen HC. Kuo SL, et al. Sci Rep. 2018 Jan 11;8(1):524. doi: 10.1038/s41598-017-18861-2. Sci Rep. 2018. PMID: 29323185 Free PMC article. - p53 in cell invasion, podosomes, and invadopodia.
Mak AS. Mak AS. Cell Adh Migr. 2014;8(3):205-14. doi: 10.4161/cam.27841. Cell Adh Migr. 2014. PMID: 24714032 Free PMC article. Review. - Store-Operated Ca2+ Entry in Tumor Progression: From Molecular Mechanisms to Clinical Implications.
Chen YF, Lin PC, Yeh YM, Chen LH, Shen MR. Chen YF, et al. Cancers (Basel). 2019 Jun 27;11(7):899. doi: 10.3390/cancers11070899. Cancers (Basel). 2019. PMID: 31252656 Free PMC article. Review. - Src and SHP2 coordinately regulate the dynamics and organization of vimentin filaments during cell migration.
Yang CY, Chang PW, Hsu WH, Chang HC, Chen CL, Lai CC, Chiu WT, Chen HC. Yang CY, et al. Oncogene. 2019 May;38(21):4075-4094. doi: 10.1038/s41388-019-0705-x. Epub 2019 Jan 29. Oncogene. 2019. PMID: 30696956 Free PMC article. - Molecular mechanisms of tumour invasion: regulation by calcium signals.
Iamshanova O, Fiorio Pla A, Prevarskaya N. Iamshanova O, et al. J Physiol. 2017 May 15;595(10):3063-3075. doi: 10.1113/JP272844. Epub 2017 Apr 21. J Physiol. 2017. PMID: 28304082 Free PMC article. Review.
References
Publication types
MeSH terms
Substances
LinkOut - more resources
Full Text Sources
Molecular Biology Databases
Miscellaneous
