The transcription factors E2A and HEB act in concert to induce the expression of FOXO1 in the common lymphoid progenitor - PubMed (original) (raw)
The transcription factors E2A and HEB act in concert to induce the expression of FOXO1 in the common lymphoid progenitor
Eva Welinder et al. Proc Natl Acad Sci U S A. 2011.
Abstract
Recent studies have identified a number of transcriptional regulators, including E proteins, EBF1, FOXO1, and PAX5, that act together to orchestrate the B-cell fate. However, it still remains unclear as to how they are linked at the earliest stages of B-cell development. Here, we show that lymphocyte development in HEB-ablated mice exhibits a partial developmental arrest, whereas B-cell development in E2A(+/-)HEB(-/-) mice is completely blocked at the LY6D(-) common lymphoid progenitor stage. We show that the transcription signatures of E2A- and HEB-ablated common lymphoid progenitors significantly overlap. Notably, we found that Foxo1 expression was substantially reduced in the LY6D(-) HEB- and E2A-deficient cells. Finally, we show that E2A binds to enhancer elements across the FOXO1 locus to activate Foxo1 expression, linking E2A and FOXO1 directly in a common pathway. In summary, the data indicate that the earliest event in B-cell specification involves the induction of FOXO1 expression and requires the combined activities of E2A and HEB.
Conflict of interest statement
The authors declare no conflict of interest.
Figures
Fig. 1.
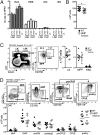
HEB is expressed in bone marrow progenitors. (A) Indicated FACS-sorted progenitor populations were analyzed by real-time PCR for the abundance of E2A, HEB, Id2, and Id3 mRNA. Values were normalized to hypoxanthine guanine phosphoribosyl transferase (HPRT) expression and are shown as mean ± SEM using purified mRNA from two independent sorts. (B) Absolute numbers of bone marrow cells (from femurs, tibias, and cresta iliac) of sex- and age-matched WT and HEBf/fTie2Cre mice. Each dot represents the number from a single mouse. The horizontal lines indicate the mean in each group. The asterisk indicates a P value < 0.05. C Left represents FACS plots of the gating strategies used to identify LK, MPP, and HSC populations. Lineage (LIN) includes CD11B, GR1, CD3ε, and NK1.1. C Right displays the absolute cell numbers of each population in WT and HEBf/fTie2Cre mice. Each dot represents the number from a single mouse, and the horizontal lines are the mean in each group. Data shown are pooled from two independent experiments. D Upper shows representative FACS plots of the gating strategy to identify erythromyeloid progenitor populations within the LK population. D Lower shows the absolute cell number of each population in WT and HEBf/fTie2Cre bone marrow. Each dot represents the number from a single mouse, and the horizontal lines are the mean in each group. Data shown are pooled from two independent experiments. MkP, megakaryocyte progenitor; GMP, granulocyte macrophage progenitor; preGM, pregranulocyte macrophage; preMegE, premegakarycocyte erythrocyte; preCFUE, pre-CFU erythrocyte; CFUE, CFU erythrocyte; proEry, proerythrocyte.
Fig. 2.
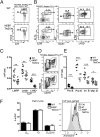
HEB is required to specify the B-cell fate. (A) Representative FACS plots of LMPPs from WT and HEBf/fTie2Cre bone marrow. Lineage (LIN) includes CD11B, GR1, TER119, CD3ε, LY6C, NK1.1, CD19, and CD11C. (B) Representative FACS plots of LY6D− CLPs and LY6D+ CLPs from WT and HEBf/fTie2Cre bone marrow. (C) Total cellularity of LMPP, LY6D− CLPs, and LY6D+ CLPs in WT and HEBf/fTie2Cre bone marrow. Each dot represents the number from a single mouse, and the horizontal lines indicate the mean in each group. Data shown are pooled from two independent experiments. **P < 0.01; ***P < 0.001. (D) Representative FACS plots of CD19+B220+ cells from WT and HEBf/fTie2Cre bone marrow. LIN includes CD11B, GR1, and TER119. (E) Total cell numbers of B-cell progenitor populations within the CD19+B220+ bone marrow B-cell populations. All populations were first gated as CD19+B220+. Pro-B, KIT+IgM−IgD−; Pre-B, KIT−IgM−IgD−; Im. B, KIT−IgM+IgD−; Mat. B, KIT−IgM+/low IgD+. Each dot represents the number from a single mouse, and the horizontal lines are the mean in each group. Data shown are pooled from two independent experiments. *P < 0.05; ***P < 0.001. F Left displays the cell cycle distribution (quantified by Ki67 and 7AAD FACS staining) of WT and HEB-deficient CLPs (n = 3 in each group). F Right shows a representative plot of Annexin V staining comparing WT and HEB-deficient CLPs (total n = 3 in each group). For F Left and F Right, CLPs are defined as depicted in B.
Fig. 3.
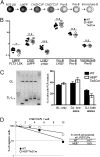
HEB promotes the transition from the LY6D− to LY6D+ CLP compartment. (A) Schematic overview of B-cell development in the bone marrow. (B) Plot of cell number ratios from the consecutive developmental stages depicted in A. The total cellularity of an early population for a mouse is divided by the total cell number of the proceeding population. Each dot represents the ratio from a single mouse, and the horizontal lines are the mean in each group. Data shown are pooled from two independent experiments. *P < 0.05; ***P < 0.001. n.s., not significant. C Left shows an example of DH–JH rearrangement PCR readouts from LY6D+ CLPs. C Right shows the distribution of cells within the LY6D+ CLP compartment with respect to DH–JH rearrangement status. A total of 192 cells/population from two independent sorts was assayed. Displayed are the mean ± SEM of cells producing at least one PCR product. (D) Result of limiting dilution assay for in vitro B-cell potential. CLPs from WT and HEB-deficient mice were sorted onto preplated OP9 stroma cells and cultured in conditions promoting B-lymphoid development. The number of cells plated per well is plotted vs. the percentages of wells negative for B-cell growth (CD19+ cells). Full lines represent the best fit regression. The frequency of cells with B-cell potential was determined as the cell concentration where 37% of the cells were not generating B cells. The frequency for WT and HEBf/fTie2Cre cells is indicated. Data shown are from a representative experiment from a total of three experiments.
Fig. 4.
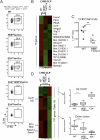
HEB and E2A act in concert to specify the B-cell fate. (A) Representative FACS plots comparing bone marrow stained for LY6D+ CLPs in WT, HEBf/fVaviCre, E2Af/+VaviCre, HEBf/fE2Af/+VaviCre, and E2Af/fVaviCre mice. (B) Microarrays analysis displaying genes that are changed by a factor of at least twofold between WT and HEBf/fTie2Cre LY6D− CLPs. E2A−/− displays how this subset of genes is affected in E2A−/− LY6D− CLPs. Displayed data are derived from the means from two or more microarray replicas using material from independent sorts. (C) Graph shows the number of CCR9+ LY6D− CLPs in WT and HEBf/fTie2Cre mice. Each dot represents the number from a single mouse, and the horizontal lines are the mean in each group. Representative data from one of a total of two experiments are shown. **P < 0.01. D Left, right column shows the result of microarray analysis, displaying genes that are changed by a factor of at least twofold between WT and E2A−/− LY6D− CLPs. In addition, the center column displays how these genes are affected in HEBf/fTie2Cre LY6D− CLPs. Highlighted in the left column is the location of genes of interest for lymphocyte development (a full gene list is in
Table S1
). D Right displays box plots of cluster analysis showing how genes patterns in D Left are changed in WT and HEB- and E2A-deficient LY6D− CLPs. ***P < 0.001. Displayed data are the means derived from two or more microarray replicas using material from independent sorts.
Fig. 5.
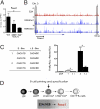
Direct regulation of Foxo1 expression in CLPs by the E proteins. (A) LY6D− CLPs from WT, HEBf/fTie2Cre, and E2A−/− mice were analyzed by real-time PCR for the abundance of Foxo1 mRNA. Values were normalized to HPRT expression and are shown as mean ± SEM using purified mRNA from two independent sorts. (B) E2A (red; top row) occupancy, H3K4me1 (blue; middle row), and H3K4me3 (blue; bottom row) epigenetics mark across the Foxo1 locus in EBF1-deficient cells identified by ChIP followed by genome-wide deep sequencing. Numbers on the left indicate the number of tags observed. The box on the left indicates a Foxo1 locus promoter region with E-box sites; the box on the right indicates a region where E2A occupancy is associated with H3K4me1. (C) Transcriptional activity of H3K4me1 islands (corresponding to the boxes in B) with associated E2A occupancy and presence of E boxes. Δ, deletion within the E-box sequences. Data shown are the mean ± SEM derived from two independent experiments. *P < 0.05. (D) Schematic diagram depicting B-cell development and the activities of E2A and HEB in B-cell specification.
Similar articles
- A global network of transcription factors, involving E2A, EBF1 and Foxo1, that orchestrates B cell fate.
Lin YC, Jhunjhunwala S, Benner C, Heinz S, Welinder E, Mansson R, Sigvardsson M, Hagman J, Espinoza CA, Dutkowski J, Ideker T, Glass CK, Murre C. Lin YC, et al. Nat Immunol. 2010 Jul;11(7):635-43. doi: 10.1038/ni.1891. Epub 2010 Jun 13. Nat Immunol. 2010. PMID: 20543837 Free PMC article. - Positive intergenic feedback circuitry, involving EBF1 and FOXO1, orchestrates B-cell fate.
Mansson R, Welinder E, Åhsberg J, Lin YC, Benner C, Glass CK, Lucas JS, Sigvardsson M, Murre C. Mansson R, et al. Proc Natl Acad Sci U S A. 2012 Dec 18;109(51):21028-33. doi: 10.1073/pnas.1211427109. Epub 2012 Dec 4. Proc Natl Acad Sci U S A. 2012. PMID: 23213261 Free PMC article. - E protein transcription factors are required for the development of CD4(+) lineage T cells.
Jones-Mason ME, Zhao X, Kappes D, Lasorella A, Iavarone A, Zhuang Y. Jones-Mason ME, et al. Immunity. 2012 Mar 23;36(3):348-61. doi: 10.1016/j.immuni.2012.02.010. Epub 2012 Mar 15. Immunity. 2012. PMID: 22425249 Free PMC article. - E proteins and the regulation of early lymphocyte development.
de Pooter RF, Kee BL. de Pooter RF, et al. Immunol Rev. 2010 Nov;238(1):93-109. doi: 10.1111/j.1600-065X.2010.00957.x. Immunol Rev. 2010. PMID: 20969587 Free PMC article. Review. - The Function of E2A in B-Cell Development.
Miyazaki M, Miyazaki K. Miyazaki M, et al. Adv Exp Med Biol. 2024;1459:97-113. doi: 10.1007/978-3-031-62731-6_5. Adv Exp Med Biol. 2024. PMID: 39017841 Review.
Cited by
- ZASC1 knockout mice exhibit an early bone marrow-specific defect in murine leukemia virus replication.
Seidel S, Bruce J, Leblanc M, Lee KF, Fan H, Ahlquist P, Young JA. Seidel S, et al. Virol J. 2013 Apr 24;10:130. doi: 10.1186/1743-422X-10-130. Virol J. 2013. PMID: 23617998 Free PMC article. - EBF1 primes B-lymphoid enhancers and limits the myeloid bias in murine multipotent progenitors.
Lenaerts A, Kucinski I, Deboutte W, Derecka M, Cauchy P, Manke T, Göttgens B, Grosschedl R. Lenaerts A, et al. J Exp Med. 2022 Nov 7;219(11):e20212437. doi: 10.1084/jem.20212437. Epub 2022 Sep 1. J Exp Med. 2022. PMID: 36048017 Free PMC article. - GSK3 temporally regulates neurogenin 2 proneural activity in the neocortex.
Li S, Mattar P, Zinyk D, Singh K, Chaturvedi CP, Kovach C, Dixit R, Kurrasch DM, Ma YC, Chan JA, Wallace V, Dilworth FJ, Brand M, Schuurmans C. Li S, et al. J Neurosci. 2012 Jun 6;32(23):7791-805. doi: 10.1523/JNEUROSCI.1309-12.2012. J Neurosci. 2012. PMID: 22674256 Free PMC article. - Global changes in the nuclear positioning of genes and intra- and interdomain genomic interactions that orchestrate B cell fate.
Lin YC, Benner C, Mansson R, Heinz S, Miyazaki K, Miyazaki M, Chandra V, Bossen C, Glass CK, Murre C. Lin YC, et al. Nat Immunol. 2012 Dec;13(12):1196-204. doi: 10.1038/ni.2432. Epub 2012 Oct 14. Nat Immunol. 2012. PMID: 23064439 Free PMC article. - Salvador-Warts-Hippo pathway in a developmental checkpoint monitoring helix-loop-helix proteins.
Wang LH, Baker NE. Wang LH, et al. Dev Cell. 2015 Jan 26;32(2):191-202. doi: 10.1016/j.devcel.2014.12.002. Epub 2015 Jan 8. Dev Cell. 2015. PMID: 25579975 Free PMC article.
References
- Yang L, et al. Identification of Lin(-)Sca1(+)kit(+)CD34(+)Flt3- short-term hematopoietic stem cells capable of rapidly reconstituting and rescuing myeloablated transplant recipients. Blood. 2005;105:2717–2723. - PubMed
- Adolfsson J, et al. Identification of Flt3+ lympho-myeloid stem cells lacking erythro-megakaryocytic potential a revised road map for adult blood lineage commitment. Cell. 2005;121:295–306. - PubMed
- Kondo M, Weissman IL, Akashi K. Identification of clonogenic common lymphoid progenitors in mouse bone marrow. Cell. 1997;91:661–672. - PubMed
Publication types
MeSH terms
Substances
LinkOut - more resources
Full Text Sources
Molecular Biology Databases
Research Materials
Miscellaneous
