Postprandial hepatic lipid metabolism requires signaling through Akt2 independent of the transcription factors FoxA2, FoxO1, and SREBP1c - PubMed (original) (raw)
Postprandial hepatic lipid metabolism requires signaling through Akt2 independent of the transcription factors FoxA2, FoxO1, and SREBP1c
Min Wan et al. Cell Metab. 2011.
Abstract
Under conditions of obesity and insulin resistance, the serine/threonine protein kinase Akt/PKB is required for lipid accumulation in liver. Two forkhead transcription factors, FoxA2 and FoxO1, have been suggested to function downstream of and to be negatively regulated by Akt and are proposed as key determinants of hepatic triglyceride content. In this study, we utilize genetic loss of function experiments to show that constitutive activation of neither FoxA2 nor FoxO1 can account for the protection from steatosis afforded by deletion of Akt2 in liver. Rather, another downstream target positively regulated by Akt, the mTORC1 complex, is required in vivo for de novo lipogenesis and Srebp1c expression. Nonetheless, activation of mTORC1 and SREBP1c is not sufficient to drive postprandial lipogenesis in the absence of Akt2. These data show that insulin signaling through Akt2 promotes anabolic lipid metabolism independent of Foxa2 or FoxO1 and through pathways additional to the mTORC1-dependent activation of SREBP1c.
Copyright © 2011 Elsevier Inc. All rights reserved.
Figures
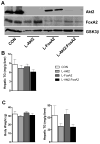
Figure 1. Akt2 Regulates Hepatic TG Accumulation Independent of FoxA2
(A) Western blot for detecting deletion of Akt2 and FoxA2 in primary hepatocytes isolated from wild type controls (CON), AFP>Cre;Akt2(loxP/loxP) (L-Akt2), AFP>Cre;FoxA2(loxP/loxP) (L-FoxA2) and AFP>Cre;Akt2(loxP/loxP);FoxA2(loxP/loxP) (L-Akt2:FoxA2) mice. Two male mice for each genotype were 2-month-old and under random-fed condition when primary hepatocytes were isolated. (B) Hepatic TG levels under random-fed conditions on normal chow in 2-month-old male mice, n=8–10 for each genotype. (C) Body weight (left) and hepatic TG levels (right) under random-fed conditions on HFD. 1-month-old male mice were subject to 3-month HFD feeding, n=6–7 for each genotype. The body weight of control mice of comparable age but maintained on normal chow was 26.2 ± 0.4g. The variance of hepatic TG levels was significant among four different genotypes by one-way ANOVA, but did not achieve statistical significance upon pairwise comparison by Tukey’s post-test; error bars represents SEM.
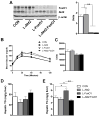
Figure 2. Loss of Hepatic Akt2 Decreases TG Accumulation in Liver Independent of FoxO1 under Normal Chow Feeding
(A) Deletion of Akt2 and FoxO1 in liver from wild type controls (CON), AFP>Cre;Akt2(loxP/loxP) (L-Akt2), AFP>Cre;Akt2(loxP/loxP) (L-FoxO1) and AFP>Cre;Akt2(loxP/loxP);FoxO1(loxP/loxP) (L-Akt2:FoxO1) mice. Three male mice for each group were sacrificed under random-fed conditions on normal chow, and liver lysates were prepared to blot for Akt2, FoxO1 and β-actin (left). Realtime PCR was performed on cDNA prepared from RNA from 2-month-old male mouse livers under random-fed conditions, n=3–5 for each genotype (right). (B) Pyruvate tolerance test (PTT). Two-month-old male mice were fasted overnight, and then injected with 2g/kg body weight pyruvate intraperitoneally. Blood glucose was determined at 0, 15, 30, 60 and 120 minutes after injection, n=4–8 for each genotype. (C) Area under curve from PTT. The variance of AUC levels was significant among four different genotypes by one-way ANOVA, but did not achieve statistical significance by pairwise comparison using Tukey’s post-test. (D) Hepatic TG levels (right) from two-month-old male mice fed normal chow after overnight fasting, n=5–7 for each genotype. (E) Hepatic TG levels from random-fed, two-month-old male mice on normal chow, n=3–5 for each group. *, P < 0.05, **, P < 0.01 by one-way ANOVA followed by Tukey’s post-test; error bars represents SEM.
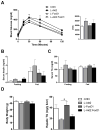
Figure 3. Loss of Hepatic Akt2 Decreases TG Accumulation in Liver Independent of FoxO1 under HFD Feeding
(A) Glucose tolerance test (GTT). Four-month-old male mice fed a HFD for 3 months were fasted overnight, and injected intraperitoneally with 2g/kg glucose (left). Area under curve were taken from GTT (right), n= 4–5 for each genotype. (B) Fasting and random-fed serum insulin levels, n=4–5 for each genotype. (C) Fasting and random-fed serum TG levels, n=4–5 for each genotype. (D) Body weight (left) and hepatic TG levels (right) under random-fed conditions on HFD, n= 4–6. Body weight from control mice that were of comparable age but maintained on normal chow was 31.5 ± 1.3g. The variance of hepatic TG levels was significant among four different genotypes by one-way ANOVA. *, P < 0.05 by one-way ANOVA followed by Tukey’s post-test; error bars represents SEM. Abbreviations are as indicated in Figure 2.
Figure 4. Loss of Hepatic Akt2 Decreases TG Accumulation in Liver Independent of FoxO1 After Aurothioglucose Treatment
(A) Mice with aurothioglucose (GTG) injection gained more weight than age-match not-treated (NT) controls. Male mice were fasted overnight, and then injected with 0.3g/kg bodyweight GTG at 4–5-week-old, and maintained on normal chow for eight weeks before analysis, n=4–8 for each genotype; *, P < 0.05 by two-way ANOVA followed by Bonferroni’s post-test. (B) Hepatic TG levels under random-fed conditions in mice injected with GTG as described above, n= 6–10 for each group. *, P < 0.05, **, P < 0.01 by one-way ANOVA followed by Tukey’s post-test; error bars represents SEM. Abbreviations are as indicated in Figure 2.
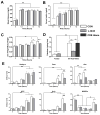
Figure 5. Akt2 is Required for de novo Lipogenesis after HCD Refeeding
(A) Blood glucose levels after HCD refeeding. Mice were pre-fed with HCD for 2 days, fasted overnight, and refed with HCD. Blood glucose was measured at the indicated time points, n=4–6 for each condition. (B) Serum insulin levels after HCD refeeding, n=4–6 for each condition. (C) Liver weight to body weight ratio after HCD refeeding, n=4–6 for each condition. (D) Newly synthesized palmitate. Mice treated as above were injected with 20ul/g bodyweight D2O three hours after HCD refeeding. 6h after refeeding, mice were sacrificed and incorporation of D2O into palmitate measured in liver, n=3–5 for each condition. (E) Lipogenic gene expression after HCD refeeding. Mice were treated as described in (A), n=4–6 for each condition. Con, wild type controls; L-Akt2, AFP>Cre;Akt2(loxP/loxP); *, P < 0.05, **, P < 0.01 by two-way ANOVA followed by Bonferroni’s post-test; error bars represents SEM.
Figure 6. Loss of Hepatic Akt2 Decreases de novo Lipogenesis Independent of FoxO1
(A) Fasting and refed blood glucose levels. Two-month-old male mice were placed on HCD for three days, fasted overnight, and refed with HCD for 6 hours. Blood glucose levels were taken at fasting, 3h refeeding and 6h refeeding time points, n= 5–7 for each genotype, **, P < 0.01 by two-way ANOVA followed by Bonferroni’s post-test, error bars represents SEM. (B) Liver weight to body weight ratio. Mice were as described above. 6h after refeeding, mice were sacrificed, and body weight and wet liver weight were determined, n=5–7 for each condition, *, P < 0.05, **, P < 0.01 by two-way ANOVA followed by Bonferroni’s post-test, error bars represents SEM. (C) De novo lipogenesis, n=4–7 for each genotype, **, P < 0.01 by one-way ANOVA followed by Tukey’s post-test; error bars represents SEM. Abbreviations are as indicated in Figure 2.
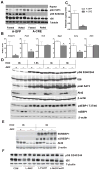
Figure 7. Raptor Is Required for Lipogenic Gene Expression and de novo Lipogenesis
(A) Western blot of Raptor knockout livers. RaptorloxP/loxP male mice were maintained on normal chow, and injected with either AAV-TBG-GFP (A-GFP) or AAV-TBG-Cre (AAV>Cre;raptor(loxP/loxP); A-CRE) at 6-weeks of age. Two weeks after virus injection, mice were fasted overnight (fasted), and then refed with normal chow for 4 hours (refed) before sacrifice. (B) Lipogenic gene expression under random-fed conditions, n=6–7 for each condition, *, p < 0.05; **, p_ < 0.01 by student _t_-test; error bars represents SEM. **(C)** _De novo_ lipogenesis, n=6–7 for each condition, **, p < 0.01 by student _t_-test; error bars represents SEM. **(D)** Western blot for liver samples from wild type controls and _AFP>Cre;Akt2(loxP/loxP) mice after refeeding HCD. Mice were treated as described in Figure 5. (E) Western blot for full-length SREBP1 (flSREBP1) and processed SREBP1 (nSREBP1). Liver samples from 24h fasted or 6h HCD refeeding control or AFP>Cre;Akt2(loxP/loxP) mice were used for blotting full-length SREBP1 and processed SREBP1. (F) Western blot for liver samples from wild type controls (CON), AFP>Cre;Akt2(loxP/loxP) (L-Akt2), AFP>Cre;FoxO1(loxP/loxP) (L-FoxO1) and AFP>Cre;Akt2(loxP/loxP);FoxO1(loxP/loxP) (L-Akt2:FoxO1) mice 6h after HCD refeeding. Mice were treated as described in Figure 6C.
Similar articles
- Hepatic mTORC2 activates glycolysis and lipogenesis through Akt, glucokinase, and SREBP1c.
Hagiwara A, Cornu M, Cybulski N, Polak P, Betz C, Trapani F, Terracciano L, Heim MH, Rüegg MA, Hall MN. Hagiwara A, et al. Cell Metab. 2012 May 2;15(5):725-38. doi: 10.1016/j.cmet.2012.03.015. Epub 2012 Apr 19. Cell Metab. 2012. PMID: 22521878 - Akt stimulates hepatic SREBP1c and lipogenesis through parallel mTORC1-dependent and independent pathways.
Yecies JL, Zhang HH, Menon S, Liu S, Yecies D, Lipovsky AI, Gorgun C, Kwiatkowski DJ, Hotamisligil GS, Lee CH, Manning BD. Yecies JL, et al. Cell Metab. 2011 Jul 6;14(1):21-32. doi: 10.1016/j.cmet.2011.06.002. Cell Metab. 2011. PMID: 21723501 Free PMC article. - Identification of Akt-independent regulation of hepatic lipogenesis by mammalian target of rapamycin (mTOR) complex 2.
Yuan M, Pino E, Wu L, Kacergis M, Soukas AA. Yuan M, et al. J Biol Chem. 2012 Aug 24;287(35):29579-88. doi: 10.1074/jbc.M112.386854. Epub 2012 Jul 7. J Biol Chem. 2012. PMID: 22773877 Free PMC article. - Connecting mTORC1 signaling to SREBP-1 activation.
Bakan I, Laplante M. Bakan I, et al. Curr Opin Lipidol. 2012 Jun;23(3):226-234. doi: 10.1097/MOL.0b013e328352dd03. Curr Opin Lipidol. 2012. PMID: 22449814 Review. - Transcriptional regulation of hepatic lipogenesis.
Wang Y, Viscarra J, Kim SJ, Sul HS. Wang Y, et al. Nat Rev Mol Cell Biol. 2015 Nov;16(11):678-89. doi: 10.1038/nrm4074. Nat Rev Mol Cell Biol. 2015. PMID: 26490400 Free PMC article. Review.
Cited by
- Treatment of hypoglycemia due to a rare pathogenic variant in AKT2 with waxy maize heat-modified starch.
Parker M, Yau D. Parker M, et al. Clin Case Rep. 2024 Feb 8;12(2):e8473. doi: 10.1002/ccr3.8473. eCollection 2024 Feb. Clin Case Rep. 2024. PMID: 38344362 Free PMC article. - Nuclear receptors reverse McGarry's vicious cycle to insulin resistance.
Moore DD. Moore DD. Cell Metab. 2012 May 2;15(5):615-22. doi: 10.1016/j.cmet.2012.03.016. Cell Metab. 2012. PMID: 22560214 Free PMC article. - PIASy-mediated sumoylation of SREBP1c regulates hepatic lipid metabolism upon fasting signaling.
Lee GY, Jang H, Lee JH, Huh JY, Choi S, Chung J, Kim JB. Lee GY, et al. Mol Cell Biol. 2014 Mar;34(6):926-38. doi: 10.1128/MCB.01166-13. Epub 2013 Dec 30. Mol Cell Biol. 2014. PMID: 24379443 Free PMC article. - PAS kinase drives lipogenesis through SREBP-1 maturation.
Wu X, Romero D, Swiatek WI, Dorweiler I, Kikani CK, Sabic H, Zweifel BS, McKearn J, Blitzer JT, Nickols GA, Rutter J. Wu X, et al. Cell Rep. 2014 Jul 10;8(1):242-55. doi: 10.1016/j.celrep.2014.06.006. Epub 2014 Jul 4. Cell Rep. 2014. PMID: 25001282 Free PMC article. - A noncanonical, GSK3-independent pathway controls postprandial hepatic glycogen deposition.
Wan M, Leavens KF, Hunter RW, Koren S, von Wilamowitz-Moellendorff A, Lu M, Satapati S, Chu Q, Sakamoto K, Burgess SC, Birnbaum MJ. Wan M, et al. Cell Metab. 2013 Jul 2;18(1):99-105. doi: 10.1016/j.cmet.2013.06.001. Cell Metab. 2013. PMID: 23823480 Free PMC article.
References
- Altomonte J, Richter A, Harbaran S, Suriawinata J, Nakae J, Thung SN, Meseck M, Accili D, Dong H. Inhibition of Foxo1 function is associated with improved fasting glycemia in diabetic mice. Am J Physiol Endocrinol Metab. 2003;285:E718–728. - PubMed
- Argaud D, Zhang Q, Pan W, Maitra S, Pilkis SJ, Lange AJ. Regulation of rat liver glucose-6-phosphatase gene expression in different nutritional and hormonal states: gene structure and 5’-flanking sequence. Diabetes. 1996;45:1563–1571. - PubMed
- Berwick DC, Hers I, Heesom KJ, Moule SK, Tavare JM. The identification of ATP-citrate lyase as a protein kinase B (Akt) substrate in primary adipocytes. J Biol Chem. 2002;277:33895–33900. - PubMed
Publication types
MeSH terms
Substances
Grants and funding
- R01 CA103866/CA/NCI NIH HHS/United States
- P30 DK019525-35/DK/NIDDK NIH HHS/United States
- P01 DK049210-15/DK/NIDDK NIH HHS/United States
- R01 DK056886/DK/NIDDK NIH HHS/United States
- R01 DK56886/DK/NIDDK NIH HHS/United States
- F30 DK081283/DK/NIDDK NIH HHS/United States
- R01 DK056886-13/DK/NIDDK NIH HHS/United States
- P30 DK019525/DK/NIDDK NIH HHS/United States
- R01 CA129105-05/CA/NCI NIH HHS/United States
- 1F30 DK081283/DK/NIDDK NIH HHS/United States
- P01 DK49210/DK/NIDDK NIH HHS/United States
- P01 DK049210/DK/NIDDK NIH HHS/United States
- R01 CA129105/CA/NCI NIH HHS/United States
LinkOut - more resources
Full Text Sources
Other Literature Sources
Molecular Biology Databases
Research Materials
Miscellaneous
