Microtubule affinity regulating kinase activity in living neurons was examined by a genetically encoded fluorescence resonance energy transfer/fluorescence lifetime imaging-based biosensor: inhibitors with therapeutic potential - PubMed (original) (raw)
Microtubule affinity regulating kinase activity in living neurons was examined by a genetically encoded fluorescence resonance energy transfer/fluorescence lifetime imaging-based biosensor: inhibitors with therapeutic potential
Thomas Timm et al. J Biol Chem. 2011.
Abstract
Protein kinases of the microtubule affinity regulating kinase (MARK)/Par-1 family play important roles in the establishment of cellular polarity, cell cycle control, and intracellular signal transduction. Disturbance of their function is linked to cancer and brain diseases, e.g. lissencephaly and Alzheimer disease. To understand the biological role of MARK family kinases, we searched for specific inhibitors and a biosensor for MARK activity. A screen of the ChemBioNet library containing ~18,000 substances yielded several compounds with inhibitory activity in the low micromolar range and capable of inhibiting MARK activity in cultured cells and primary neurons, as judged by MARK-dependent phosphorylation of microtubule-associated proteins and its consequences for microtubule integrity. Four of the compounds share a 9-oxo-9H-acridin-10-yl structure as a basis that will serve as a lead for optimization of inhibition efficiency. To test these inhibitors, we developed a cellular biosensor for MARK activity based on a MARK target sequence attached to the 14-3-3 scaffold protein and linked to enhanced cyan or teal and yellow fluorescent protein as FRET donor and acceptor pairs. Transfection of the teal/yellow fluorescent protein sensor into neurons and imaging by fluorescence lifetime imaging revealed that MARK was particularly active in the axons and growth cones of differentiating neurons.
Figures
FIGURE 1.
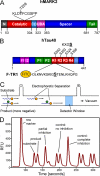
Bar diagrams of MARK and hTau40. A, shown is a bar diagram of MARK2 as a representative for the four mammalian MARK isoforms. All MARKs share a similar architecture with high homologies in the catalytic domain, common docking site (CD), ubiquitin-associated domain (UBA), and kinase-associated domain. Variations are found mostly in the spacer domain and the N-terminal header (N). The activation loop in the catalytic domain contains a critical threonine (Thr-208 in MARK2, indicated above), whose phosphorylation by MARKK or LKB1 is required for full activity. By contrast, phosphorylation of Ser-212 by GSK3β is inhibitory. B, shown is FITC-labeled peptide derived from the first repeat of the Tau protein containing the residue Ser-262 (underlined) that is phosphorylated by MARK isoforms. C, shown is a schematic drawing of the separation of substrate and product by capillary electrophoresis on the LabChip™. The chip holds 12 parallel channels. D, shown is an example of a chromatogram showing substrate and product peaks of sample with no inhibition or partial and complete inhibition. RFU, relative fluorescence units.
FIGURE 2.
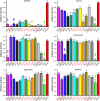
Dose-response curves of the 12 best compounds in comparison with compound HD01 (green line) and DMSO (red line). A, dose-response curves were measured at an ATP concentration of 100 μ
m
. Note that some compounds (e.g. 30195) do not completely inhibit MARK, even at 50 μ
m
(probably due to limited solubility in aqueous solutions). B, inhibition efficiency is not altered by full activation of MARK with MARKK (shown here for compound 30199). C, inhibition, shown here for compounds 30199 and 39621 at a concentration of 20 μ
m
, is released with increasing concentrations of ATP (black and green curves) but not with increasing concentrations of the substrate peptide TR1 (red and blue curves). This indicates an ATP competitive mode of action of the compounds. D, compound 30199 inhibits MARKs but not SADK and AMPK. The compound does not discriminate between the individual MARK-isoforms (cyan, red, green, and magenta) but is far less effective against AMPK and SADK-B (blue and black).
FIGURE 3.
Cross-reactivity of compounds with selected kinases. Although HD01 inhibits all kinases tested (green arrows), the identified compounds exhibit distinct specificities. Thus, compound 25000 not only inhibits MARK (IC50 = 4.2 μ
m
, Table 1) but also GSK3β (IC50 = 7.5 μ
m
, pink arrow). The compounds 30019, 30195, 30197, and 30199 (red) share a similar structure and show only small effects on SAD-B (orange arrow), a close relative of MARK. Substance 26859 has a completely different structure and has only moderate effects on the other kinases except Cdc2 (blue arrow), whereas substances 26203 and 39621 are specific for MARK (red circles).
FIGURE 4.
Structures of the identified inhibitory compounds. Shown is a comparison of the structures of HD01 and the identified inhibitors. Four of the compounds (30019, 30195, 30197, and 30199) share a 9-oxo-9H-acridin-10-yl functionality (structure shown in red). The red circles highlight the MARK-specific compounds 26203 and 39621.
FIGURE 5.
Effects of MARK2 inhibitors in cellular assays. A and B, MARK2 wild type or MARK2 inactive mutant (A2) was expressed in stably hTau40-transfected cells. The cyan fluorescent protein channel highlights MARK-transfected cells, Ser(P)-262-Tau (Tau-pS262; 12E8 epitope, K_X_GS phosphorylation) is shown in green, and tubulin (Yl1/2) is in red. A, transfection of active wild type MARK2 results in increased Ser(P)-262-Tau signals (see arrows; compare with non-transfected cells), breakdown of microtubules, and reduced cell size. B, transfection of the inactive mutant of MARK2 (MARK2A2) does not increase K_X_GS phosphorylation and does not alter the cell shape (see the arrows). C, treatment of cells transfected by active MARK with the inhibitor 39621 results in the restoration of the microtubule network and reduction of phosphorylation at K_X_GS sites (12E8 signals), thus, suppressing the toxicity caused by MARK2 (see the arrows). D, quantification of cell size relative to MARK2A2-transfected cells is shown. E, quantification of pTau (12E8 immunofluorescence intensities units) after background subtraction (12E8 signals in MARK2A2-transfected cells) is shown. Error bars: S.E. from 35–45 cells for each condition. * indicates p < 0.05; *** indicates p < 0.001 (analysis of variance with post-hoc Dunnett's Multiple Comparisons Test versus control (MARK2wt)). Scale bars: 10 μm.
FIGURE 6.
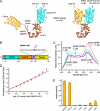
Schematic diagram and in vitro properties of the MARK activity reporter. A, a MARK-specific target peptide (derived from residues 210–223 of Cdc25C, GLYRSP_S_MPENLNR) containing the phosphorylation site Ser-216 is fused via linkers (in parentheses) to 14-3-3 protein (brown), with ECFP and YFP (citrine) as a FRET pair at both ends. Upon phosphorylation, the target sequence binds into the pocket of 14-3-3, which closes up and generates an enhancement of the FRET signal. TFP, teal fluorescent protein. B, shown is a bar diagram of the MARK activity reporter (MARK-AR1). For in vitro studies, the protein was labeled with a polyhistidine tag (H; gray), allowing simple and rapid purification. N and C denominate the N and C termini of the construct. C, shown is a wavelength scan of the unphosphorylated and phosphorylated MARK-AR1. The fluorescence of the unphosphorylated MARK-AR1 shows a maximum at 476 nm (green curve), whereas the maximum for the phosphorylated protein is shifted to 523 nm due to FRET (red curve). The inhibitors HD01 (blue curve), 30199 (cyan curve), and 39621 (pink curve) prevent the phosphorylation by MARK. Inhibitor concentrations were 5 μ
m
(HD01) and 20 μ
m
(30199 and 39621). Shown in parentheses is the ratio of the emission at 523 nm to the emission at 476 nm. D, the ratio of the emission at 523 nm to the emission at 476 nm can be taken as a measure of activity, as it shows a linear relationship to the phosphorylation of the activity reporter. The x axis displays the amount of incorporated radioactively labeled phosphate into the MARK-AR1, whereas the y axis shows the corresponding emission ratios, ranging from 1.08 (no phosphorylation) to 1.94 (complete phosphorylation of the target site). E, MARK-AR1 can be phosphorylated by MARK and SAD-B. Other kinases reported to phosphorylate Cdc25C cannot effectively phosphorylate this activity reporter.
FIGURE 7.
Functionality test of MARK-AR1 in CHO cells. CHO cells were transfected with MARK-AR1 and HA-tagged MARK2. 20 h after transfection cells were fixed and imaged. The upper panel shows both channels of the fluorescence intensity image (A and B) of a cell transfected with MARK-AR1-only, hence, no HA/Cy3-staining of MARK2 in C and the pseudo-colored fluorescence lifetime (FLIM) in D. The green color in D corresponds to a long fluorescence lifetime of 2.43 ns (no FRET). The cell shown in the lower panel is co-transfected with MARK-AR1 (E and F) and HA-MARK2 (G). The short (2.18 ns) fluorescence lifetime in the presence of active MARK is shown as red (high FRET) in H. The graph (I) displays the averaged histograms of cells showing FRET (red dots, n = 8) or no FRET (green dots; n = 8) and gaussian fits of the data. The peaks are centered at 2.182 ± 0.001 ns (FRET) and 2.427 ± 0.001 ns (no FRET).
FIGURE 8.
Endogenous MARK activity is localized in the termini of the neurites in differentiated PC12 cells. PC12 cells were transfected with MARK-AR1. 18 h after transfection cells were differentiated with 100 ng/ml NGF for 1 h and fixed. Fluorescence intensity image shows the expression and distribution of transfected MARK-AR1 (A, ECFP; B, citrine). The fluorescence lifetime image (C) reveals the strongest FRET signal in the termini of the neurite, indicating the presence of local MARK activity. The whole cell has an average lifetime of 2.4 ns (D, gray curve), whereas the tip of the neurite has an average lifetime of 2.2 ns (C, inset; D, red curve).
FIGURE 9.
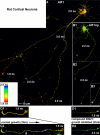
The MARK activity reporter detects endogenous MARK activity in living neurons. A, primary cortical neurons (8 DIV) from E18 rats were transfected with MARK-AR1. Live cell FLIM images were taken at 10 DIV. Strongest MARK activity is detected in fast migrating, “active” growth cones (1.9 ns) with a decreasing gradient of the kinase activity down the axon. A second group of growth cones displays lower activity (2.0 ns) and migration speed (inactive). There is also endogenous MARK activity in the cell body, dendrites, and the proximal region of the axon. B, cells expressing the non-phosphorylate-able mutant MARK-AR1np display a homogeneous higher lifetime (2.2 ns) of the donor, representing the situation of a non-FRET activity reporter. This demonstrates that the FRET signals shown in cells with the wild type activity reporter are dependent on phosphorylation and not on other intra- or intermolecular interactions. In addition it simulates the situation of no MARK-activity in the cells. C and D, MARK-AR1 displays the effect of MARK inhibitors in living cells. 8 DIV primary cortical neurons from E18 rats were transfected with MARK-AR1 and incubated either with DMSO as control (C1 and C2) or with the specific MARK-inhibitor 39621 (D1 and D2). Cells were imaged before (upper images) and 180 min after addition of chemicals (lower images). In the control cell the active growth cone advanced during incubation. The activity of MARK, indicated by a short lifetime of fluorescence (1.9 ns) in the growth cone, was not reduced (C1 and C2). Treatment with the specific inhibitor 39621 resulted in a stop of growth accompanied by an increase of lifetime from 1.9 to 2.2 ns in the growth cone, shown by a shift of the pseudo-colored image from red (D1) to green (D2). For detailed fluorescence lifetimes and migration speeds, see Table 2.
Similar articles
- Glycogen synthase kinase (GSK) 3beta directly phosphorylates Serine 212 in the regulatory loop and inhibits microtubule affinity-regulating kinase (MARK) 2.
Timm T, Balusamy K, Li X, Biernat J, Mandelkow E, Mandelkow EM. Timm T, et al. J Biol Chem. 2008 Jul 4;283(27):18873-82. doi: 10.1074/jbc.M706596200. Epub 2008 Apr 18. J Biol Chem. 2008. PMID: 18424437 - TRESK background K(+) channel is inhibited by PAR-1/MARK microtubule affinity-regulating kinases in Xenopus oocytes.
Braun G, Nemcsics B, Enyedi P, Czirják G. Braun G, et al. PLoS One. 2011;6(12):e28119. doi: 10.1371/journal.pone.0028119. Epub 2011 Dec 1. PLoS One. 2011. PMID: 22145024 Free PMC article. - MARK/PAR1 kinase is a regulator of microtubule-dependent transport in axons.
Mandelkow EM, Thies E, Trinczek B, Biernat J, Mandelkow E. Mandelkow EM, et al. J Cell Biol. 2004 Oct 11;167(1):99-110. doi: 10.1083/jcb.200401085. Epub 2004 Oct 4. J Cell Biol. 2004. PMID: 15466480 Free PMC article. - Canonical and noncanonical roles of Par-1/MARK kinases in cell migration.
McDonald JA. McDonald JA. Int Rev Cell Mol Biol. 2014;312:169-99. doi: 10.1016/B978-0-12-800178-3.00006-3. Int Rev Cell Mol Biol. 2014. PMID: 25262242 Review. - Fluorescent biosensors - probing protein kinase function in cancer and drug discovery.
Morris MC. Morris MC. Biochim Biophys Acta. 2013 Jul;1834(7):1387-95. doi: 10.1016/j.bbapap.2013.01.025. Epub 2013 Feb 1. Biochim Biophys Acta. 2013. PMID: 23376184 Review.
Cited by
- Microtubule affinity-regulating kinase 2 is associated with DNA damage response and cisplatin resistance in non-small cell lung cancer.
Hubaux R, Thu KL, Vucic EA, Pikor LA, Kung SH, Martinez VD, Mosslemi M, Becker-Santos DD, Gazdar AF, Lam S, Lam WL. Hubaux R, et al. Int J Cancer. 2015 Nov 1;137(9):2072-82. doi: 10.1002/ijc.29577. Epub 2015 May 6. Int J Cancer. 2015. PMID: 25907283 Free PMC article. - Protein kinase sensors: an overview of new designs for visualizing kinase dynamics in single plant cells.
Zhang L, Takahashi Y, Schroeder JI. Zhang L, et al. Plant Physiol. 2021 Oct 5;187(2):527-536. doi: 10.1093/plphys/kiab277. Plant Physiol. 2021. PMID: 35142856 Free PMC article. Review. - Probing the Inhibition of Microtubule Affinity Regulating Kinase 4 by N-Substituted Acridones.
Voura M, Khan P, Thysiadis S, Katsamakas S, Queen A, Hasan GM, Ali S, Sarli V, Hassan MI. Voura M, et al. Sci Rep. 2019 Feb 8;9(1):1676. doi: 10.1038/s41598-018-38217-8. Sci Rep. 2019. PMID: 30737440 Free PMC article. - Amyloid-β oligomers induce synaptic damage via Tau-dependent microtubule severing by TTLL6 and spastin.
Zempel H, Luedtke J, Kumar Y, Biernat J, Dawson H, Mandelkow E, Mandelkow EM. Zempel H, et al. EMBO J. 2013 Nov 13;32(22):2920-37. doi: 10.1038/emboj.2013.207. Epub 2013 Sep 24. EMBO J. 2013. PMID: 24065130 Free PMC article. - The Tumor Suppressor NKX3.1 Is Targeted for Degradation by DYRK1B Kinase.
Song LN, Silva J, Koller A, Rosenthal A, Chen EI, Gelmann EP. Song LN, et al. Mol Cancer Res. 2015 May;13(5):913-22. doi: 10.1158/1541-7786.MCR-14-0680. Epub 2015 Mar 16. Mol Cancer Res. 2015. PMID: 25777618 Free PMC article.
References
- Kemphues K. (2000) Cell 101, 345–348 - PubMed
- Nance J. (2005) Bioessays 27, 126–135 - PubMed
- Shulman J. M., Benton R., St. Johnston D. (2000) Cell 101, 377–388 - PubMed
- Drewes G., Ebneth A., Preuss U., Mandelkow E. M., Mandelkow E. (1997) Cell 89, 297–308 - PubMed
Publication types
MeSH terms
Substances
LinkOut - more resources
Full Text Sources
Other Literature Sources


