Translational analysis of mouse and human placental protein and mRNA reveals distinct molecular pathologies in human preeclampsia - PubMed (original) (raw)
. 2011 Dec;10(12):M111.012526.
doi: 10.1074/mcp.M111.012526. Epub 2011 Oct 10.
Parveen Sharma, Andreas I Evangelou, Kathie Whiteley, Vladimir Ignatchenko, Alex Ignatchenko, Dora Baczyk, Marie Czikk, John Kingdom, Janet Rossant, Anthony O Gramolini, S Lee Adamson, Thomas Kislinger
Affiliations
- PMID: 21986993
- PMCID: PMC3237089
- DOI: 10.1074/mcp.M111.012526
Translational analysis of mouse and human placental protein and mRNA reveals distinct molecular pathologies in human preeclampsia
Brian Cox et al. Mol Cell Proteomics. 2011 Dec.
Abstract
Preeclampsia (PE) adversely impacts ~5% of pregnancies. Despite extensive research, no consistent biomarkers or cures have emerged, suggesting that different molecular mechanisms may cause clinically similar disease. To address this, we undertook a proteomics study with three main goals: (1) to identify a panel of cell surface markers that distinguish the trophoblast and endothelial cells of the placenta in the mouse; (2) to translate this marker set to human via the Human Protein Atlas database; and (3) to utilize the validated human trophoblast markers to identify subgroups of human preeclampsia. To achieve these goals, plasma membrane proteins at the blood tissue interfaces were extracted from placentas using intravascular silica-bead perfusion, and then identified using shotgun proteomics. We identified 1181 plasma membrane proteins, of which 171 were enriched at the maternal blood-trophoblast interface and 192 at the fetal endothelial interface with a 70% conservation of expression in humans. Three distinct molecular subgroups of human preeclampsia were identified in existing human microarray data by using expression patterns of trophoblast-enriched proteins. Analysis of all misexpressed genes revealed divergent dysfunctions including angiogenesis (subgroup 1), MAPK signaling (subgroup 2), and hormone biosynthesis and metabolism (subgroup 3). Subgroup 2 lacked expected changes in known preeclampsia markers (sFLT1, sENG) and uniquely overexpressed GNA12. In an independent set of 40 banked placental specimens, GNA12 was overexpressed during preeclampsia when co-incident with chronic hypertension. In the current study we used a novel translational analysis to integrate mouse and human trophoblast protein expression with human microarray data. This strategy identified distinct molecular pathologies in human preeclampsia. We conclude that clinically similar preeclampsia patients exhibit divergent placental gene expression profiles thus implicating divergent molecular mechanisms in the origins of this disease.
Figures
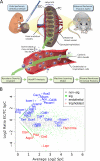
Fig. 1.
Proteomics strategy to identify novel proteins at the fetal and maternal blood-tissue interfaces in the mouse placenta. A, Scheme of our applied workflow. Cationic silica-beads were perfused via the maternal aorta to reach trophoblast lined maternal blood spaces or via the umbilical cord to reach fetal endothelial-lined vessels in the placental labyrinth. Silica-beads were isolated from labyrinth tissue to obtain in vivo surface-associated proteins. Proteins isolated from beads were analyzed by MudPIT-based proteomics. B, A zoomed-in scatter plot representation of the entire dataset highlighting known markers of endothelial cells (EC; blue text) and trophoblast cells (TC; red text). Green data points were significantly associated with either the EC or TC surfaces (FDR p value ≤0.1), whereas gray data points did not significantly differ (FDR p value >0.1).
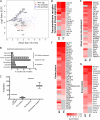
Fig. 2.
Plasma membrane markers of the blood-tissue interface in the mouse placenta. A, A plot of the log2 transformed ratio of SpC in the EC over the TC versus the mean SpC of the EC and TC of proteins predicted to be plasma membrane associated by BasesNet machine learning. Proteins are color coded to represent those that were significantly enriched to the TC fraction (n = 171; red), EC fraction (n = 191; blue), or not statistically enriched (n = 891; gray). The plot is annotated with the same known markers presented in Fig. 1_B. B_, A chart showing selected significantly enriched annotation terms in the membrane predicted data set. Represented are the percentages of genes linked to an enriched term. C, Box plot showing that the predictive membrane data set was enriched for annotation terms CD antigen and surfaceome (36) significantly better than random sampling of the entire dataset. D–G, Heat map displays of selected, significantly over-represented functional classes in the plasma membrane enriched proteins showing differences in expression between TC and EC fractions. Heat maps are sorted in order of highest to lowest expression in TC. Although there is a high degree of similarity between the trophoblast (TC) and endothelial (EC) compartments there are some key differences in protein expression.
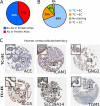
Fig. 3.
Immunohistochemistry validation of mass spectrometry-based proteomics data using the Human Protein Atlas database. A, Availability of antibodies in the Human Protein Atlas for 171 trophoblast enriched plasma membrane proteins identified in the mouse placenta. B, Systematic scoring results from all IHC images available at the Human Protein Atlas. Images were scored as “strongest staining in the fetal trophoblast” (TC>EC), “staining equally in the endothelium and trophoblast cells” (EC = TC), “no staining observed” or “staining stronger in the fetal endothelium” (TC<EC). C) Representative images from Human Protein Atlas (ProteinAtlas.org) for proteins enriched to either the trophoblast (ALG5, SLC39A14, TGM1) or endothelial (ACE, ICAM1, GNG2) cells.
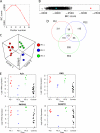
Fig. 4.
Classification of human PE patient mRNA expression data into molecular-based subgroups. A, Plot of Bayesian Information Criterion (BIC) scores versus models with increasing numbers of subgroups using gene expression data of human preeclamptic placentas (49) based on 143 trophoblast enriched proteins. B, Strip chart of BIC scores for the optimal model solution for the 143 trophoblast enriched proteins (red filled square) and 1150 random draws of 143 probes (black open squares) and the top 143 differentially regulated probes on the arrays (blue filled square). C, 3D plot of first three principal components of patient samples colored based on their subgroup membership (1 is red, 2 is blue and 3 is green). Plot shows strong segregation between subgroups and clustering within subgroups. D, Venn diagram of the overlap of differentially regulated genes in each group. Of note is the higher degree of overlap between groups 1 and 3. E, Strip charts of the microarray probe signal for individual patient samples showing four known markers of PE (FLT1, ENG, PAPPA2, ADAM12). Note that in each case the samples in subgroup 2 have a signal that is in the range of the controls. Subgroups 1 and 3 have a mean expression that is significantly higher (p < 0.01) than controls for all PE markers, whereas for subgroup 2 these markers are not significantly different than controls.
Fig. 5.
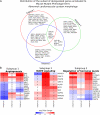
Differential enrichment of gene functional categories among human PE subgroups. A, Distribution of the 94 genes deregulated in the PE patient mRNA expression dataset annotated with the mouse mutant phenotype term abnormal cardiovascular systems morphology. Fewer than 30% show overlap with at least one other patient group although each group was independently assessed as enriched in this functional category. This suggests different molecular pathways are affected in each subgroup leading to a similar phenotypic outcome. B, Specific functional categories are enriched in each subgroup. Heat maps show similar expression for some members of each category across PE subgroups, but the majorities are uniquely deregulated in a single subgroup. Red intensity is increasing and blue is decreasing fold change of a subgroup versus controls. Numbers in the individual cells of the heat map indicate if the observed change is significant at a FDR corrected p value ≤ 0.05: −1 significantly down-regulated, 0 no significance and 1 significantly up-regulated.
Fig. 6.
Correlation of GNA12 expression with human PE and chronic hypertension. A–B, Box plot representation of densitometry readings from Western blot results for two selected trophoblast surface markers identified in the current study versus the patient groups: Control, IUGR-preeclampsia (Mixed) and preeclampsia without IUGR (PE). Statistical differences between groups were calculated using the Wilcoxson test for nonparametric data. Significant differences between controls and either Mixed or PE patients were observed for GNA12. A control protein GPR50, for which we did not observe any significant difference by microarray, had no significant difference by proteins. p values are reported at the 95% confidence level. C, Pair wise correlation plot of GNA12 and GPR50 protein expression and mother/fetus/child clinical data showing significant correlation of GNA12 with chronic hypertension (CHTN; green box bottom row on right). Also of note is the correlation with other signs of PE such as abnormal umbilical Doppler (green box bottom row on left). D–E, strip chart of GNA12 and GPR50 protein expression of individual patients colored by presence of (red triangles) or absence (black boxes) of chronic hypertension. GNA12 expression was statistically higher in the chronic hypertension group (p < 0.05) versus the non-chronic hypertension group in either the mixed or PE groups. None of the controls had chronic hypertension.
Similar articles
- Heme Oxygenase-1 Is Not Decreased in Preeclamptic Placenta and Does Not Negatively Regulate Placental Soluble fms-Like Tyrosine Kinase-1 or Soluble Endoglin Secretion.
Tong S, Kaitu'u-Lino TJ, Onda K, Beard S, Hastie R, Binder NK, Cluver C, Tuohey L, Whitehead C, Brownfoot F, De Silva M, Hannan NJ. Tong S, et al. Hypertension. 2015 Nov;66(5):1073-81. doi: 10.1161/HYPERTENSIONAHA.115.05847. Epub 2015 Aug 31. Hypertension. 2015. PMID: 26324507 - Novel expression of EGFL7 in placental trophoblast and endothelial cells and its implication in preeclampsia.
Lacko LA, Massimiani M, Sones JL, Hurtado R, Salvi S, Ferrazzani S, Davisson RL, Campagnolo L, Stuhlmann H. Lacko LA, et al. Mech Dev. 2014 Aug;133:163-76. doi: 10.1016/j.mod.2014.04.001. Epub 2014 Apr 19. Mech Dev. 2014. PMID: 24751645 Free PMC article. - Metformin as a prevention and treatment for preeclampsia: effects on soluble fms-like tyrosine kinase 1 and soluble endoglin secretion and endothelial dysfunction.
Brownfoot FC, Hastie R, Hannan NJ, Cannon P, Tuohey L, Parry LJ, Senadheera S, Illanes SE, Kaitu'u-Lino TJ, Tong S. Brownfoot FC, et al. Am J Obstet Gynecol. 2016 Mar;214(3):356.e1-356.e15. doi: 10.1016/j.ajog.2015.12.019. Epub 2015 Dec 22. Am J Obstet Gynecol. 2016. PMID: 26721779 - TGFβ signalling: a nexus between inflammation, placental health and preeclampsia throughout pregnancy.
Horvat Mercnik M, Schliefsteiner C, Sanchez-Duffhues G, Wadsack C. Horvat Mercnik M, et al. Hum Reprod Update. 2024 Jul 1;30(4):442-471. doi: 10.1093/humupd/dmae007. Hum Reprod Update. 2024. PMID: 38519450 Free PMC article. Review. - Membrane and soluble forms of endoglin in preeclampsia.
Oujo B, Perez-Barriocanal F, Bernabeu C, Lopez-Novoa JM. Oujo B, et al. Curr Mol Med. 2013 Sep;13(8):1345-57. doi: 10.2174/15665240113139990058. Curr Mol Med. 2013. PMID: 23826920 Review.
Cited by
- Identification and analysis of multi-protein complexes in placenta.
Wang F, Wang L, Xu Z, Liang G. Wang F, et al. PLoS One. 2013 Apr 29;8(4):e62988. doi: 10.1371/journal.pone.0062988. Print 2013. PLoS One. 2013. PMID: 23638173 Free PMC article. - The role of genetics in pre-eclampsia and potential pharmacogenomic interventions.
Williams PJ, Morgan L. Williams PJ, et al. Pharmgenomics Pers Med. 2012;5:37-51. doi: 10.2147/PGPM.S23141. Epub 2012 Jan 20. Pharmgenomics Pers Med. 2012. PMID: 23226061 Free PMC article. - Large scale aggregate microarray analysis reveals three distinct molecular subclasses of human preeclampsia.
Leavey K, Bainbridge SA, Cox BJ. Leavey K, et al. PLoS One. 2015 Feb 13;10(2):e0116508. doi: 10.1371/journal.pone.0116508. eCollection 2015. PLoS One. 2015. PMID: 25679511 Free PMC article. - Genomic imprinting in human placentation.
Kobayashi EH, Shibata S, Oike A, Kobayashi N, Hamada H, Okae H, Arima T. Kobayashi EH, et al. Reprod Med Biol. 2022 Dec 1;21(1):e12490. doi: 10.1002/rmb2.12490. eCollection 2022 Jan-Dec. Reprod Med Biol. 2022. PMID: 36465588 Free PMC article. Review. - Maternal Iron Deficiency Modulates Placental Transcriptome and Proteome in Mid-Gestation of Mouse Pregnancy.
Cao C, Prado MA, Sun L, Rockowitz S, Sliz P, Paulo JA, Finley D, Fleming MD. Cao C, et al. J Nutr. 2021 May 11;151(5):1073-1083. doi: 10.1093/jn/nxab005. J Nutr. 2021. PMID: 33693820 Free PMC article.
References
- Roberts J. M., Cooper D. W. (2001) Pathogenesis and genetics of pre-eclampsia. Lancet 357, 53–56 - PubMed
- van 't Veer L. J., Dai H., van de Vijver M. J., He Y. D., Hart A. A., Mao M., Peterse H. L., van der Kooy K., Marton M. J., Witteveen A. T., Schreiber G. J., Kerkhoven R. M., Roberts C., Linsley P. S., Bernards R., Friend S. H. (2002) Gene expression profiling predicts clinical outcome of breast cancer. Nature 415, 530–536 - PubMed
- Sibai B. M. (2003) Diagnosis and management of gestational hypertension and preeclampsia. Obstet. Gynecol. 102, 181–192 - PubMed
- MacKay A. P., Berg C. J., Atrash H. K. (2001) Pregnancy-related mortality from preeclampsia and eclampsia. Obstet. Gynecol. 97, 533–538 - PubMed
- Davisson R. L., Hoffmann D. S., Butz G. M., Aldape G., Schlager G., Merrill D. C., Sethi S., Weiss R. M., Bates J. N. (2002) Discovery of a spontaneous genetic mouse model of preeclampsia. Hypertension 39, 337–342 - PubMed
Publication types
MeSH terms
Substances
LinkOut - more resources
Full Text Sources
Other Literature Sources
