Discovery of candidate serum proteomic and metabolomic biomarkers in ankylosing spondylitis - PubMed (original) (raw)
Comparative Study
. 2012 Feb;11(2):M111.013904.
doi: 10.1074/mcp.M111.013904. Epub 2011 Oct 13.
Affiliations
- PMID: 21997733
- PMCID: PMC3277768
- DOI: 10.1074/mcp.M111.013904
Comparative Study
Discovery of candidate serum proteomic and metabolomic biomarkers in ankylosing spondylitis
Roman Fischer et al. Mol Cell Proteomics. 2012 Feb.
Abstract
Ankylosing Spondylitis (AS) is a common inflammatory rheumatic disease with a predilection for the axial skeleton, affecting 0.2% of the population. Current diagnostic criteria rely on a composite of clinical and radiological changes, with a mean time to diagnosis of 5 to 10 years. In this study we employed nano liquid-chromatography mass spectrometry analysis to detect and quantify proteins and small compounds including endogenous peptides and metabolites in serum from 18 AS patients and nine healthy individuals. We identified a total of 316 proteins in serum, of which 22 showed significant up- or down-regulation (p < 0.05) in AS patients. Receiver operating characteristic analysis of combined levels of serum amyloid P component and inter-α-trypsin inhibitor heavy chain 1 revealed high diagnostic value for Ankylosing Spondylitis (area under the curve = 0.98). We also depleted individual sera of proteins to analyze endogenous peptides and metabolic compounds. We detected more than 7000 molecular features in patients and healthy individuals. Quantitative MS analysis revealed compound profiles that correlate with the clinical assessment of disease activity. One molecular feature identified as a Vitamin D3 metabolite-(23S,25R)-25-hydroxyvitamin D3 26,23-peroxylactone-was down-regulated in AS. The ratio of this vitamin D metabolite versus vitamin D binding protein serum levels was also altered in AS as compared with controls. These changes may contribute to pathological skeletal changes in AS. Our study is the first example of an integration of proteomic and metabolomic techniques to find new biomarker candidates for the diagnosis of Ankylosing Spondylitis.
Figures
Fig. 1.
Workflow for accessing proteins and small molecules in serum. The proteomic workflow comprises a biochemical depletion of IgGs and albumin followed by tryptic digest and nLC-MS analysis with a LTQ Oribitrap Velos (Thermo) instrument in triplicate. For the metabolomic workflow, proteins in sera of AS patients and healthy individuals were precipitated with chloroform and methanol two times. The aqueous phase was filtered through a molecular cutoff filter (5 kDa). The flow-through was analyzed for small molecules by nLC-MS with a QTOF 6250 (Agilent) in triplicate. In both workflows the data was analyzed with Progenesis LCMS (nonlinear Dynamics).
Fig. 2.
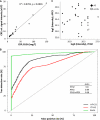
MS-based quantitation of CRP correlates strictly with ELISA. MS-based quantitation of APCS and ITIH2 has diagnostic utility for Ankylosing Spondylitis. A, CRP concentration as measured by ELISA was plotted against median signal intensities of CRP derived peptides measured by MS exhibiting a close correlation between MS and ELISA readout. B, ROC analysis shows the diagnostic utility of combined quantitation of APCS and ITIH2. C, Signal intensities of APCS and ITIH2 exhibit orthogonality in the detection of AS. In patients where APCS is not up-regulated we observe a down-regulation of ITIH2 and vice versa. 1) represents two overlaying “no AS” data points.
Fig. 3.
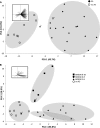
Principal Component Analysis of selected molecular features distinguishes healthy individuals from AS patients and correlates with disease activity. A, LC-MS analysis revealed 215 molecular features with defined chromatographic and isotopic profiles exhibiting significant differences in abundance between AS and controls (ANOVA p < 0.01). Principal Component Analysis (PCA) with this set allows separation of AS from healthy control subjects. Ten molecular features selected for their highest separation power (PC1 loadings, as visualized in the inserted diagram), are sufficient to separate AS from controls (PCA in
supplemental Fig. S1
). B, A set of 65 molecular features was used for a PCA (ANOVA p ≤ 0.01) after classifying the AS patients into BASDAI groups, which indicate the severity of their symptoms (PC loadings visualized in diagram insert). Patients with most severe symptoms could be separated from the low and medium disease activity groups. Again the control group could be separated from the cases with the exception of one individual (2) with the lowest BASDAI in the cohort and one control individual (1) with the highest age in the control group.
Fig. 4.
Detection of a molecular feature at m/z 445. 2957 and matching of the measured isotopic patterns to compound candidates with the same mass (± 5ppm). A, A singly charged compound was detected at m/z of 445.2957, well separated from the lock-mass of PCM (M+H+ = 445.120024 Da). The left signal represents the strongest signal in the control group whereas the right signal represents the strongest signal in the AS group. The mass of the detected compound can be matched to nine different chemical formulae. The elemental composition of each theoretical compound generates a specific isotopic profile because of the natural abundance of heavy isotopes of each element. The only compound matching the detected isotopic profiles of (B) the monomer at m/z 445.2957, (C) the dimer at m/z 889.5768 and (D) the trimer at m/z 1333.857 is a molecule with the monomeric formula C27H40O5.
Fig. 5.
Differential regulation of a compound at m/z 445. 2957 and its identification as the Vitamin D3 metabolite (23S,25R)-25-hydroxyvitamin D3 26,23-peroxylactone. A, The compound with a precursor ion mass m/z of 445.2957 is down-regulated in AS patients (ANOVA p ≤ 5.44E-15). B, The MS/MS spectrum of the compound exhibits characteristic fragment ions for (23S,25R)-25-hydroxyvitamin D3 26,23-peroxylactone. Fragment 1) represents the precursor after loss of water, 2) and 3) the secosteroid nucleus before and after water-loss, and 4) the conjugated ring system after water-loss.
Similar articles
- Discovery of Potential Serum Protein Biomarkers in Ankylosing Spondylitis Using Tandem Mass Tag-Based Quantitative Proteomics.
Liu S, Ji W, Lu J, Tang X, Guo Y, Ji M, Xu T, Gu W, Kong D, Shen Q, Wang D, Lv X, Wang J, Zhu T, Zhu Y, Liu P, Su J, Wang L, Li Y, Gao P, Liu W, Sun L, Yin X, Zhou W. Liu S, et al. J Proteome Res. 2020 Feb 7;19(2):864-872. doi: 10.1021/acs.jproteome.9b00676. Epub 2020 Jan 15. J Proteome Res. 2020. PMID: 31917576 - Serum amino acid metabolic profiles of ankylosing spondylitis by targeted metabolomics analysis.
Zhou Y, Zhang X, Chen R, Han S, Liu Y, Liu X, Gao M, Yang C, Lu D, Sun B, Chen H. Zhou Y, et al. Clin Rheumatol. 2020 Aug;39(8):2325-2336. doi: 10.1007/s10067-020-04974-z. Epub 2020 Mar 4. Clin Rheumatol. 2020. PMID: 32130577 - Screening and identification of serum biomarkers of osteoarticular tuberculosis based on mass spectrometry.
Chen X, Jia X, Lei H, Wen X, Hao Y, Ma Y, Ye J, Wang C, Gao J. Chen X, et al. J Clin Lab Anal. 2020 Jul;34(7):e23297. doi: 10.1002/jcla.23297. Epub 2020 Mar 12. J Clin Lab Anal. 2020. PMID: 32162728 Free PMC article. - Translational Metabolomics of Head Injury: Exploring Dysfunctional Cerebral Metabolism with Ex Vivo NMR Spectroscopy-Based Metabolite Quantification.
Wolahan SM, Hirt D, Glenn TC. Wolahan SM, et al. In: Kobeissy FH, editor. Brain Neurotrauma: Molecular, Neuropsychological, and Rehabilitation Aspects. Boca Raton (FL): CRC Press/Taylor & Francis; 2015. Chapter 25. In: Kobeissy FH, editor. Brain Neurotrauma: Molecular, Neuropsychological, and Rehabilitation Aspects. Boca Raton (FL): CRC Press/Taylor & Francis; 2015. Chapter 25. PMID: 26269925 Free Books & Documents. Review. - [Vitamin D levels in ankylosing spondylitis: does deficiency correspond to disease activity?].
Pokhai GG, Bandagi S, Abrudescu A. Pokhai GG, et al. Rev Bras Reumatol. 2014 Jul-Aug;54(4):330-4. doi: 10.1016/j.rbr.2014.03.027. Epub 2014 Aug 26. Rev Bras Reumatol. 2014. PMID: 25627231 Review. Portuguese.
Cited by
- Large-Scale Genetic Correlation Analysis between Spondyloarthritis and Human Blood Metabolites.
Yang M, Xu J, Zhang F, Luo P, Xu K, Feng R, Xu P. Yang M, et al. J Clin Med. 2023 Feb 2;12(3):1201. doi: 10.3390/jcm12031201. J Clin Med. 2023. PMID: 36769847 Free PMC article. - KDM2B links the Polycomb Repressive Complex 1 (PRC1) to recognition of CpG islands.
Farcas AM, Blackledge NP, Sudbery I, Long HK, McGouran JF, Rose NR, Lee S, Sims D, Cerase A, Sheahan TW, Koseki H, Brockdorff N, Ponting CP, Kessler BM, Klose RJ. Farcas AM, et al. Elife. 2012 Dec 18;1:e00205. doi: 10.7554/eLife.00205. Elife. 2012. PMID: 23256043 Free PMC article. - Proteomic Profiling for Serum Biomarkers in Mice Exposed to Ionizing Radiation.
Huang J, Wang Q, Hu Y, Qi Z, Lin Z, Ying W, Zhou M. Huang J, et al. Dose Response. 2019 Dec 12;17(4):1559325819894794. doi: 10.1177/1559325819894794. eCollection 2019 Oct-Dec. Dose Response. 2019. PMID: 31853238 Free PMC article. - Gas Chromatography-Mass Spectrometry Reveals Stage-Specific Metabolic Signatures of Ankylosing Spondylitis.
Guo Y, Wei S, Yin M, Cao D, Li Y, Wen C, Zhou J. Guo Y, et al. Metabolites. 2023 Oct 7;13(10):1058. doi: 10.3390/metabo13101058. Metabolites. 2023. PMID: 37887383 Free PMC article. - Metabolomics in rheumatic diseases: desperately seeking biomarkers.
Guma M, Tiziani S, Firestein GS. Guma M, et al. Nat Rev Rheumatol. 2016 May;12(5):269-81. doi: 10.1038/nrrheum.2016.1. Epub 2016 Mar 3. Nat Rev Rheumatol. 2016. PMID: 26935283 Free PMC article. Review.
References
- Elyan M., Khan M. A. (2006) Diagnosing ankylosing spondylitis. J. Rheumatol. 78, 12–23 - PubMed
- Rostom S., Dougados M., Gossec L. (2010) New tools for diagnosing spondyloarthropathy. Joint Bone Spine 77, 108–114 - PubMed
- Thomas G. P., Brown M. A. (2010) Genomics of ankylosing spondylitis. Discov. Med. 10, 263–271 - PubMed
- Dougados M., Baeten D. (2011) Spondyloarthritis. Lancet 377, 2127–2137 - PubMed
- Thomas G. P., Brown M. A. (2010) Genetics and genomics of ankylosing spondylitis. Immunol. Rev. 233, 162–180 - PubMed
Publication types
MeSH terms
Substances
LinkOut - more resources
Full Text Sources
Medical
Research Materials


