Autophagy machinery mediates macroendocytic processing and entotic cell death by targeting single membranes - PubMed (original) (raw)
Autophagy machinery mediates macroendocytic processing and entotic cell death by targeting single membranes
Oliver Florey et al. Nat Cell Biol. 2011.
Abstract
Autophagy normally involves the formation of double-membrane autophagosomes that mediate bulk cytoplasmic and organelle degradation. Here we report the modification of single-membrane vacuoles in cells by autophagy proteins. LC3 (Light chain 3) a component of autophagosomes, is recruited to single-membrane entotic vacuoles, macropinosomes and phagosomes harbouring apoptotic cells, in a manner dependent on the lipidation machinery including ATG5 and ATG7, and the class III phosphatidylinositol-3-kinase VPS34. These downstream components of the autophagy machinery, but not the upstream mammalian Tor (mTor)-regulated ULK-ATG13-FIP200 complex, facilitate lysosome fusion to single membranes and the degradation of internalized cargo. For entosis, a live-cell-engulfment program, the autophagy-protein-dependent fusion of lysosomes to vacuolar membranes leads to the death of internalized cells. As pathogen-containing phagosomes can be targeted in a similar manner, the death of epithelial cells by this mechanism mimics pathogen destruction. These data demonstrate that proteins of the autophagy pathway can target single-membrane vacuoles in cells in the absence of pathogenic organisms.
Figures
Figure 1
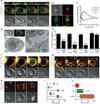
Entotic cell death involves recruitment of LC3 to a single-membrane vacuole. (a) Confocal time-lapse images of an MCF10A cell-in-cell structure expressing GFP-LC3 and H2B-mCherry. Arrow marks recruitment of LC3 to the entotic vacuole, see Supplementary Information Movie S1. Bar = 15µm. (b) Images of MCF10A expressing GFP-LC3G120A and mCherry-LC3; note no recruitment of GFP-LC3G120A to entotic vacuole. Bar = 15µm (c) LC3 recruits from host cell cytosol onto the entotic vacuole membrane. Data points are mean fluorescence intensity of GFP-LC3 on vacuoles versus cytoplasm for two independent cell-in-cell structures, see Supplementary Information Movie S2. (d) Correlative video-light electron microscopy of MCF10A GFP-LC3 cell-in-cell structure. Cells were imaged by time-lapse, followed by fixation after LC3 recruitment, see Supplementary Information Movie S3. Post-fixation images (top panels) of phase and GFP were taken demonstrating LC3 recruitment. Electron microscopy of the same cell shows the entotic vacuole is a single membrane (arrow). (e) Percentage of MCF10A cell-in-cell structures, with and without autophagy inhibition, that show LC3 recruitment associated with death of internalized cell. Data represent mean +/− SEM from at least 3 independent experiments, n=total number of death events. *P<0.03, ***P<0.0001. Time-lapse images of MCF10A cell-in-cell structures expressing either: (f) 2xFYVE-mCherry (red) and GFP-LC3 (green), or (g) Lamp1-GFP (green) and mCherry-LC3 (red). Arrows indicate recruitments to the entotic vacuole, see Supplementary Information Movies S4 and S5. Times are indicated as hr:min:sec (f) or min (g). Bar = 5µm. (h) Representative images of cell-in-cell structures where only host cells express CathepsinB-mCherry. Live inner cell with no CathepsinB in the vacuole, arrow (left panel), live internalized cell with CathepsinB from the host inside of the vacuole, arrow head (middle panel), dead internalized cell with CathepsinB from the host throughout the corpse, asterisk (right panel). Bar = 15µm. (i) Five representative timings of GFP-LC3 recruitment to entotic vacuoles (green bar) and death of internalized cells (X) from time-lapse microscopy. (j) Initiation and duration of 2xFYVE domain (red bar, n=11), LC3 (green bar, n=20) and Lamp1 (orange bar, n=7) recruitment to entotic vacuoles, determined using double expressing cells shown in (f, g). Error bars represent SD.
Figure 2
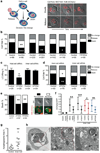
Autophagy machinery in host cells controls the fate of starving internalized cells. (a) Model depicting the multiple cell fates of internalized cells; arrow thickness represents relative frequency of events. Images of cell-in-cell structures (1=host cell, 2=internalized cell) that show a cell death (top images) or release event (bottom images). Bar = 15µm. (b) Quantification of MCF10A internalized cell fate over 20 hours following autophagy inhibition. Data represent mean from at least 3 independent experiments, n=total number of structures analyzed, #P<0.02, ##P<0.007, *P<0.01, **P<0.004. (c, d) Quantification of LC3 recruitment (c), and cell fate (d), of mixed cell-in-cell structures where host or internalized cells were treated with ATG5 siRNA. Data represent mean +/− SEM from 3 separate experiments. *P<0.01, **P<0.004. (e) Quantification of type of internalized cell death after autophagy inhibition, n=total death events analyzed. Data represent mean of 3 independent experiments. **P<0.03. Representative images of non-apoptotic and apoptotic death of internalized cell; arrow points to fragmented apoptotic nuclei. Bar = 15µm. (f) Quantification of mCherry/GFP ratio of live MCF10A single cells or internalized cells expressing tandem GFP-mCherry-LC3, with or without siRNA treatment as indicated. Data represent mean +/− SD; n= numbers of cells analyzed for each data point (from left to right) 30, 30, 30, 25, 30, 25, 25, 25, 30, 27.; *P<0.03, **P<0.003, ***P<0.0004. (g) Quantification of percentage of autophagosome and autolysosome area in control MCF10A (n=10) and internalized cell (n=10) cytoplasm imaged by electron microscopy, **P<0.005. (h) Representative electron micrographs of cell-in-cell structures (left panel), internalized cell cytoplasm (middle and right panel) showing autophagosomes (arrow) and autolysosomes (arrow head).
Figure 3
Inhibition of apoptosis and entotic cell death promotes anchorage-independent growth. (a) The fate of internalized cells (control MCF10A and MCF10A expressing E7 and Bcl2) was measured with and without autophagy inhibition. Data show the percentage of internalized cell release with autophagy inhibition, compared with each control without autophagy inhibition; mean+/− s.e.m. from at least three independent experiments (total cell numbers analysed: ATG5 siRNA, 261 cells; Bcl2 ATG5 siRNA, 97 cells; 3-MA, 170 cells; Bcl2 3-MA, 112 cells); *P < 0:05, **P < 0:02: (b) Effects of Y27632, 3-MA and _VPS34_ and _ATG5_ siRNA on MCF10A cell-in-cell formation in suspension for 7 hours, >300 cells per condition were scored for cell-in-cell formation, +/− SEM from 3 independent experiments, *P<0.02. (c) Representative image of MCF10A E7+Bcl2 cell-in-cell structure formed in soft agar. Arrow marks LC3 recruitment around internalized cells. Bar = 5µm. (d) Quantification of MCF10A E7+Bcl2 cell-in-cell structures 48 hours after seeding into soft agar (white bars), and colony formation after 2 weeks (gray bars), representative wells are shown in (e). Data represent mean +/− SEM from 3 independent experiments, *P<0.03, **P<0.004, ***P<0.001. (f) Quantification of MCF10A E7+Bcl2 colony formation with Atg5 knockdown with 2 separate siRNAs; representative wells are shown in (g). Data represent mean +/− SEM from 3 independent experiments, *P<0.001. See also Supplementary Information MovieS6.
Figure 4
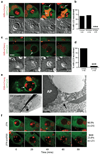
LC3 recruits to single membrane vacuoles containing apoptotic cells to facilitate corpse degradation. (a) Time-lapse images of MCF10A cell-in-cell structures with internalized cell that undergoes apoptosis. Arrows mark the recruitment of LC3 around apoptotic fragments, see Supplementary Information Movie S7. Bar = 10µm. (b) Quantification of LC3 recruitment to apoptotic internalized cells in the presence of ATG5 or FIP200 siRNA (n=number of cells analyzed), ***P<0.0001, chi-square test. (c) Apoptotic U937 cells expressing H2B-mCherry phagocytized by J774 macrophages expressing GFP-LC3. Confocal images show LC3 recruitment to engulfed corpse (arrow), see Supplementary Information Movie S8. Bar = 15µm. (d) Quantification of LC3 recruitment to apoptotic phagosomes in control and shATG5 expressing cells, ***P<0.0001, chi-square test. (e) Correlative light electron microscopy of an apoptotic phagosome with GFP-LC3 recruitment (top image, white arrow). The LC3-loaded phagosome consists of a single membrane (right image, black arrow) (AP= apoptotic cell nucleus). (f) Representative images of apoptotic cell phagocytosis and degradation in control (n=21) and shATG5 (n=21) J774 GFP-LC3 cells, ***P<0.0001, chi-square test. Bar = 10µm. See also Supplementary Information Fig. S3.
Figure 5
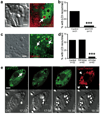
LC3 recruits to macropinosomes independent of macroautophagy. (a) Representative image of J774 macrophage expressing GFP-LC3 incubated in media containing red dextran. Image shows LC3 recruitment to a dextran-containing macropinosome (arrow). Bar = 2µm. (b) Quantification of LC3 recruitment to macropinosomes in control and shATG5 J774 macrophage; n=number of macropinosomes analyzed, ***P<0.0001, chi-square test. See Supplementary Information Movie S9. c) Representative image of LC3 recruitment to macropinosomes (arrows) in MCF10A cells expressing GFP-LC3 incubated with red dextran. Bar = 2µm. (d) Quantification of LC3 recruitment to macropinosomes in MCF10A cells treated with siRNA against FIP200 or ATG5; n=number of macropinosomes analyzed, ***P<0.0001, chi square test. (e) J774 GFP-LC3 macrophages were incubated with 3µm uncoated latex beads and imaged by confocal microscopy for 1 hour, followed by addition of Lysotracker red to mark acidified compartments. A macropinosome recruited LC3 (arrow) while engulfed latex beads did not (arrow heads). Bar = 5µm. See Supplementary Information Movie S10.
Figure 6
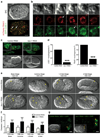
LGG-1 recruitment to apoptotic phagosomes during C.elegans embryonic development. (a) C. elegans embryo expressing mCherry::Rab-5 and GFP::LGG-1. Arrows point to two apoptotic phagosomes. See Supplementary Information Movie S11. Bar = 10µm. (b) Cropped time-lapse images showing RAB-5 and LGG-1 recruitment to an apoptotic phagosome (from panel a, left arrow). (c) Representative images of apoptotic phagosomes in embryos from control RNAi or bec-1 RNAi fed worms. (d) Quantification of GFP::LGG-1 and mCherry::RAB-5 positive phagosomes in control or bec-1 RNAi embryos determined by time-lapse imaging. Control = 21 embryos, 52 phagosomes, bec-1 = 9 embryos, 25 phagosomes, ***P<0.0001, chi-square test. (e) Representative DIC images from control and bec-1 RNAi embryos at different stages of development (minutes post first division). Yellow arrows mark apoptotic corpses. Bar = 10µm. (f) Quantification of apoptotic corpses in control and bec-1 RNAi embryos, data show +/−SD, P<***0.0001. (g) Representative images of CED-1::GFP embryos with control or bec-1 RNAi. Yellow arrows mark engulfed corpses surrounded by CED-1::GFP.
Comment in
- Cell death: the single-membrane diet.
Bickenson AF. Bickenson AF. Nat Rev Mol Cell Biol. 2011 Oct 27;12(12):767. doi: 10.1038/nrm3224. Nat Rev Mol Cell Biol. 2011. PMID: 22030832 No abstract available.
Similar articles
- V-ATPase and osmotic imbalances activate endolysosomal LC3 lipidation.
Florey O, Gammoh N, Kim SE, Jiang X, Overholtzer M. Florey O, et al. Autophagy. 2015;11(1):88-99. doi: 10.4161/15548627.2014.984277. Autophagy. 2015. PMID: 25484071 Free PMC article. - mTOR regulates phagosome and entotic vacuole fission.
Krajcovic M, Krishna S, Akkari L, Joyce JA, Overholtzer M. Krajcovic M, et al. Mol Biol Cell. 2013 Dec;24(23):3736-45. doi: 10.1091/mbc.E13-07-0408. Epub 2013 Oct 2. Mol Biol Cell. 2013. PMID: 24088573 Free PMC article. - Resveratrol-mediated autophagy requires WIPI-1-regulated LC3 lipidation in the absence of induced phagophore formation.
Mauthe M, Jacob A, Freiberger S, Hentschel K, Stierhof YD, Codogno P, Proikas-Cezanne T. Mauthe M, et al. Autophagy. 2011 Dec;7(12):1448-61. doi: 10.4161/auto.7.12.17802. Autophagy. 2011. PMID: 22082875 Free PMC article. - Biological Roles of Alternative Autophagy.
Shimizu S. Shimizu S. Mol Cells. 2018 Jan 31;41(1):50-54. doi: 10.14348/molcells.2018.2215. Epub 2018 Jan 23. Mol Cells. 2018. PMID: 29370693 Free PMC article. Review. - Autophagy proteins in macroendocytic engulfment.
Florey O, Overholtzer M. Florey O, et al. Trends Cell Biol. 2012 Jul;22(7):374-80. doi: 10.1016/j.tcb.2012.04.005. Epub 2012 May 19. Trends Cell Biol. 2012. PMID: 22608991 Free PMC article. Review.
Cited by
- Non-canonical autophagy drives alternative ATG8 conjugation to phosphatidylserine.
Durgan J, Lystad AH, Sloan K, Carlsson SR, Wilson MI, Marcassa E, Ulferts R, Webster J, Lopez-Clavijo AF, Wakelam MJ, Beale R, Simonsen A, Oxley D, Florey O. Durgan J, et al. Mol Cell. 2021 May 6;81(9):2031-2040.e8. doi: 10.1016/j.molcel.2021.03.020. Epub 2021 Apr 27. Mol Cell. 2021. PMID: 33909989 Free PMC article. - The autophagic machinery ensures nonlytic transmission of mycobacteria.
Gerstenmaier L, Pilla R, Herrmann L, Herrmann H, Prado M, Villafano GJ, Kolonko M, Reimer R, Soldati T, King JS, Hagedorn M. Gerstenmaier L, et al. Proc Natl Acad Sci U S A. 2015 Feb 17;112(7):E687-92. doi: 10.1073/pnas.1423318112. Epub 2015 Feb 2. Proc Natl Acad Sci U S A. 2015. PMID: 25646440 Free PMC article. - Selective Lysosome Membrane Turnover Is Induced by Nutrient Starvation.
Lee C, Lamech L, Johns E, Overholtzer M. Lee C, et al. Dev Cell. 2020 Nov 9;55(3):289-297.e4. doi: 10.1016/j.devcel.2020.08.008. Epub 2020 Sep 10. Dev Cell. 2020. PMID: 32916093 Free PMC article. - Knockdown of NEAT1 prevents post-stroke lipid droplet agglomeration in microglia by regulating autophagy.
Pan Y, Xin W, Wei W, Tatenhorst L, Graf I, Popa-Wagner A, Gerner ST, Huber SE, Kilic E, Hermann DM, Bähr M, Huttner HB, Doeppner TR. Pan Y, et al. Cell Mol Life Sci. 2024 Jan 12;81(1):30. doi: 10.1007/s00018-023-05045-7. Cell Mol Life Sci. 2024. PMID: 38212456 Free PMC article. - Oxidized mitochondrial nucleoids released by neutrophils drive type I interferon production in human lupus.
Caielli S, Athale S, Domic B, Murat E, Chandra M, Banchereau R, Baisch J, Phelps K, Clayton S, Gong M, Wright T, Punaro M, Palucka K, Guiducci C, Banchereau J, Pascual V. Caielli S, et al. J Exp Med. 2016 May 2;213(5):697-713. doi: 10.1084/jem.20151876. Epub 2016 Apr 18. J Exp Med. 2016. PMID: 27091841 Free PMC article.
References
- Kawane K, et al. Requirement of DNase II for definitive erythropoiesis in the mouse fetal liver. Science. 2001;292:1546–1549. - PubMed
- Broadie K. Axon pruning: an active role for glial cells. Curr Biol. 2004;14:R302–R304. - PubMed
- Savina A, Amigorena S. Phagocytosis and antigen presentation in dendritic cells. Immunol Rev. 2007;219:143–156. - PubMed
Publication types
MeSH terms
Substances
LinkOut - more resources
Full Text Sources
Other Literature Sources
Research Materials
Miscellaneous
