SIRT2 maintains genome integrity and suppresses tumorigenesis through regulating APC/C activity - PubMed (original) (raw)
. 2011 Oct 18;20(4):487-99.
doi: 10.1016/j.ccr.2011.09.004.
Athanassios Vassilopoulos, Rui-Hong Wang, Tyler Lahusen, Zhen Xiao, Xiaoling Xu, Cuiling Li, Timothy D Veenstra, Bing Li, Hongtao Yu, Junfang Ji, Xin Wei Wang, Seong-Hoon Park, Yong I Cha, David Gius, Chu-Xia Deng
Affiliations
- PMID: 22014574
- PMCID: PMC3199577
- DOI: 10.1016/j.ccr.2011.09.004
SIRT2 maintains genome integrity and suppresses tumorigenesis through regulating APC/C activity
Hyun-Seok Kim et al. Cancer Cell. 2011.
Abstract
Members of sirtuin family regulate multiple critical biological processes, yet their role in carcinogenesis remains controversial. To investigate the physiological functions of SIRT2 in development and tumorigenesis, we disrupted Sirt2 in mice. We demonstrated that SIRT2 regulates the anaphase-promoting complex/cyclosome activity through deacetylation of its coactivators, APC(CDH1) and CDC20. SIRT2 deficiency caused increased levels of mitotic regulators, including Aurora-A and -B that direct centrosome amplification, aneuploidy, and mitotic cell death. Sirt2-deficient mice develop gender-specific tumorigenesis, with females primarily developing mammary tumors, and males developing more hepatocellular carcinoma (HCC). Human breast cancers and HCC samples exhibited reduced SIRT2 levels compared with normal tissues. These data demonstrate that SIRT2 is a tumor suppressor through its role in regulating mitosis and genome integrity.
Copyright © 2011 Elsevier Inc. All rights reserved.
Figures
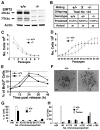
Figure 1. SIRT2 Deficiency Reduces Proliferation of MEFs but Does Not Affect Animal Survival
(A) Western blot analysis of proteins extracted from adult Sirt2+/+ (+/+) and Sirt2−/− (−/−) mice. WT mice have two forms of SIRT2, 43 KD and 37KD, and both are absent in mutant mice. (B) Number of predicted and actual offspring from interbreeding of heterozygous mice. (C–D) Growth curve of Sirt2+/+ and Sirt2−/− MEFs from passages 1 to 7 (C), and 20–58 (D) (MEFs cells from at least 5 pairs of embryos were analyzed in this experiment). (E) BrdU incorporation of MEFs released from serum starvation. (F–H) Chromosome spread (F) and summary of chromosome number from wild-type and SIRT2−/− MEFs at P2 (G), and at P35 (H) (three pairs at each passage). The chromosome number of three primary tumors from mammary gland (2) and liver (1) was also included in (H). Data are presented as average ± SD. Scale bars = 10 μm in (F) (See also Figure S1)
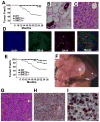
Figure 2. Absence of SIRT2 Results in Tumor Formation in Multiple Organs
(A) Kaplan–Meier survival curve showing cancer incidence in SIRT2−/− (n = 26), SIRT2+/− (n = 13), and WT (n = 22) female mice. (B–C) Histological sections of a mammary gland from wild-type mice (B) and an adenocarcinoma (C) from SIRT2 mutant mice. Scale bars = 10 μm (D) Immunofluorescent staining of an adenocarcinoma using basal (CK14) and luminal (K18) markers. Scale bars = 10 μm (E) Kaplan–Meier survival curve showing cancer incidence in SIRT2−/− (n = 19), SIRT2+/− (n = 10), and WT (n = 20) male mice. (F,G) Whole-mount view (F) and histological section (G) of a HCC from liver of SIRT2 mutant mice. Scale bars = 10 μm in (G) (H,I) Proliferation assay using Ki67 staining; 20 × (H) and 63 × (I) magnifications. Scale bars = 10 μm. (See also Table S1 and Figure S2)
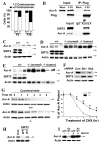
Figure 3. Loss of SIRT2 Causes Centrosome Amplification That Is Associated with Increased Expression of Aurora-A
(A) SIRT2 deficiency results in centrosome amplification in MEFs. Centrosome number of 181 and 175 SIRT2−/− cells were counted at passage (P) 2 and P36, while 212 and 120 wild-type cells were counted at P2 and P36, respectively. Percentage of cells with normal number (1–2/cell) and abnormal number (>2/cells) of centrosomes were shown. (B) Interaction between SIRT2 and Aurora-A (Aur-A). 293T cells were transiently transfected with flag-SIRT2 (F-S2) expression vector or mock vector (pCMV5), lysed with IP buffer, and lysates were immunoprecipitated with either anti-Flag conjugated beads (upper panel) or antibody to endogenous Aurora-A (lower panel). Blots were immunoblotted with either anti-SIRT2, Flag, or Aurora-A antibodies. 5% of input was used in all panels. (C–E) SIRT2 deficiency results in an increase of Aurora-A protein in MEFs (C), mammary tissues (“normal”, D) and mammary tumors (D), and liver and liver tumors (E). (F) shRNA-mediated acute knockdown of SIRT2 increases Aurora-A in HepG2 cells. Two lentiviral-based shRNA constructs against different region of SIRT2 (Sh1 and Sh2) and control (pLKO.1-Luc) are used. (G) Aurora-A protein is more stable in SIRT2−/− MEFs than in SIRT2 WT MEFs at G1 phase. Cells were kept in serum free medium for 72 hours, re-plated in 15% FBS DMEM for 4 hours, and then treated with 10 μg/ml of cycloheximide (CHX) at the indicated time points before subjected to Western Blot. The experiments were repeated three times and band intensities were measured using Image Lab Version 3.0. Statistic analysis was provided on the right panel. * represents student ρ value <0.005. (H–I) Ectopic overexpression of SIRT2-WT, but not SIRT2-HY reduces Aurora-A in SIRT2−/− MEFs (Con: pcDNA3.1 vector only) (H), but this effect is blocked in the presence of 10 μM of MG132 for 24 hours (I). (See also Figure S3)
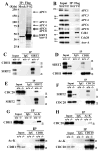
Figure 4. SIRT2 Interacts with APC/C and Deacetylates CDH1 and CDC20
(A) Mass spectrometry analysis of Flag-SIRT2-interactingproteins after transfection of Flag-SIRT2 into HeLa cells. Lysates were immunoprecipitated with anti-Flag-agarose beads and eluted using Flag peptide, resolved by SDS-PAGE gel, and subjected to mass spectrometry analysis. (B) Immunoblots of Flag-SIRT2 interacting proteins. (C–F) Reciprocal co-immunoprecipitation of endogenous SIRT2 and CDH1 (C,D) or CDC20 (E,F) from immortalized SIRT2+/+ and SIRT2−/− MEF cells. After synchronization using serum starvation for 72 hr, cells were released into normal media for 16 hr and harvested for co-immunoprecipitation. The lysates were immunoprecipitated with anti-SIRT2, -CDH1, or CDC20 antibodies, respectively, and IPed samples were analyzed by immunoblotting with anti-SIRT2, -CDH1, or –CDC20, respectively. (G,H) In vivo deacetylation analysis of endogenous CDH1 (G) and –CDC20 (H) from liver of SIRT2 WT and KO mice 48 hours after partial hepatectomy. (See also Figure S4)
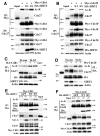
Figure 5. SIRT2 Regulates the Function of CDH1 and CDC20 through Deacetylation
(A) Overexpression of WT but not deacetylase mutant (HY) SIRT2 decreases CDH1 acetylation and increases its interaction with CDC27 in HeLa cells. Ac-K: pan-acetyl lysine antibody. (B) Overexpression of WT but not deacetylase mutant (HY) SIRT2 decreases CDC20 acetylation and increases its interaction with phospho-CDC27 in HeLa cells. (C–D) Knockdown of SIRT2 by siRNA increases acetylation of CDH1 (C) and CDC20 (D) and decreases interaction with CDC27 or with phospho-CDC27, respectively, in HeLa cells. Si-S2 (siRNA against Sirt2), Si-Con (scramble siRNA). (E) SIRT2 deficiency increases acetylation of CDH1 and decreases its interaction with CDC27, which is accompanied by an increase in Aurora-A in immortalized Sirt2 +/+ and −/− MEF cells. (F) SIRT2 deficiency increases acetylation of CDC20 and decreases its interaction with CDC27 in immortalized SIRT2 WT and KO MEF cells. In all above panels, 24 hours after transfection, cells were synchronized by double thymidine block (HeLa cells) or serum starvation for 48 hr (MEF cells), released into regular media for 12 hr or 18 hr, respectively, Input: lysates from non-transfected and unsynchronized cells (5% in relation to IP samples) were used as control to distinguish phospho-CDC27 (migration slower) and non-phospho-CDC27. (See also Figure S5)
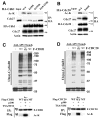
Figure 6. Analysis of acetylation sites in CDH1 and CDC20 and their effect on APC/C activity
(A,B) Mutations of Cdh1 (K69R, K159R, and K69/159R) (A) and CDC20 (K66R) (B), which mimic the deacetylation of lysine residue, reduces their interaction with CDC27, as revealed by IP against HA-Cdh1 (A) and HA-Cdc20 (B) followed by Western blot against Cdc27. (C,D) in vitro APC/C activity assay using Cyclin B1 ubiquitination as reporter in the presence or absence of acetylated or non-acetylated forms of CDH1 (C) and CDC20 (D) proteins purified from 293T cells and HeLa cells, respectively. Lane 1, reaction mix without adding CDH1 or CDC20 proteins. Lane 2, non-acetylated forms of Flag tagged wild type (WT) CDH1 or CDC20. Line 3, acetylated forms of Flag tagged wild type (Ac-WT) CDH1 or CDC20. Lane 4, Flag tagged CDH1-K69/159R or CDC20-K66R (MT). Lower panels show status of acetylation of CDH1 and CDC20.
Figure 7. SIRT2 Regulates Aurora-A Levels Mediated by APC/C
(A) Knockdown of SIRT2 by siRNA against Sirt2 (Si-S2), but not scramble siRNA (Si-Con), in HeLa cells increases expression level of Aurora-A and Aurora-B (Aur-B) protein. (B) Increased level of Aurora-A is correlated with reduced Aurora-A. After co-transfection with indicated plasmids and Si-S2) into HeLa cells for 24 hrs, cells were treated with 10 μM of MG132 for 4 hrs. Lysates were immunoprecipitated with Flag antibody conjugated-beads, and immunoblotted with indicated antibodies. (C) Overexpression of HA-tagged SIRT2-WT, but not SIRT2-HY (HA-S2), reduces expression levels of Aurora-A and Aurora-B compared with GFP transfected HeLa cells. (D) Reduces level of Aurora-A is associated with increased ubiquitination. After transfection with indicated plasmids for 24 hrs, cells were treated with 10 μM of MG132 for 4 hrs. Lysates were immunoprecipitated with Flag antibody conjugated-beads, and immunoblotted with indicated antibodies. (E) Effect of SIRT2 on the protein level of Aurora-A and -B was blocked by CDC27 knockdown. Lysates were analyzed by Western blot 48 hours after co-transfection with indicated plasmids, siRNA against Cdc27 (Si-Cdc27) or scramble siRNA (Si-Con) into HeLa cells. (F) Western blot analysis of protein lysates in primary SIRT2 +/+ and −/− MEFs (Passage 2) after mitotic release for indicated time points. Cells were synchronized by serum starvation for 72 hr, replaced with normal media containing nocodazole for 18 hr, and then mitotic cells collected were replated and harvested at indicated time points for Western blot analysis. (See also Figure S6)
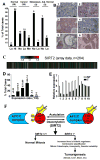
Figure 8. SIRT2 Gene Expression in Human Cancers
(A) Comparison of SIRT2 protein levels revealed by tissue array in 36 pairs of primary breast cancers and adjacent normal breast tissues, as well as 9 pairs of lymph node metastatic infiltrating ductal carcinomas and cancer adjacent normal lymph node tissues (adj. normal). Levels of SIRT2 staining were classified as high (Hi), medium (Me), low (Lo), and negative (No). (B) Examples of immunohistochemical images of 3 primary cancers (1: No; 2: Lo, 3: Me), 1 lymph node metastatic infiltrating ductal carcinoma (4: No), and 2 adjacent normal breast tissues (5: Lo; 6: Hi). Scale bars = 10 μm. (C–D) SIRT2 expression levels from microarray data of 264 HCC samples (C), presented as raw log2 ratio (tumor/normal: T/N) (D). Red represents high ratio of T/N and green represents low ratio of T/N. (E) Real-time RT-PCR of 10 pairs of samples was also presented. Data shown is average ±SD. (F) A model illustrating actions of SIRT2 in regulating APC/C activity through deacetylation of CDH1 and CDC20, which is critical for maintaining normal mitosis. SIRT2 deficiency impairs APC/C activity, leading to mitotic catastrophe, genetic instability, and tumorigenesis. (See also Figure S7)
Similar articles
- APC/C Cdh1 targets aurora kinase to control reorganization of the mitotic spindle at anaphase.
Floyd S, Pines J, Lindon C. Floyd S, et al. Curr Biol. 2008 Nov 11;18(21):1649-58. doi: 10.1016/j.cub.2008.09.058. Epub 2008 Oct 30. Curr Biol. 2008. PMID: 18976910 - Bub1 and aurora B cooperate to maintain BubR1-mediated inhibition of APC/CCdc20.
Morrow CJ, Tighe A, Johnson VL, Scott MI, Ditchfield C, Taylor SS. Morrow CJ, et al. J Cell Sci. 2005 Aug 15;118(Pt 16):3639-52. doi: 10.1242/jcs.02487. Epub 2005 Jul 26. J Cell Sci. 2005. PMID: 16046481 - Male germ cell-associated kinase is overexpressed in prostate cancer cells and causes mitotic defects via deregulation of APC/CCDH1.
Wang LY, Kung HJ. Wang LY, et al. Oncogene. 2012 Jun 14;31(24):2907-18. doi: 10.1038/onc.2011.464. Epub 2011 Oct 10. Oncogene. 2012. PMID: 21986944 Free PMC article. - Correction of microtubule-kinetochore attachment errors: mechanisms and role in tumor suppression.
Ricke RM, van Deursen JM. Ricke RM, et al. Semin Cell Dev Biol. 2011 Aug;22(6):559-65. doi: 10.1016/j.semcdb.2011.03.007. Epub 2011 Mar 23. Semin Cell Dev Biol. 2011. PMID: 21439393 Free PMC article. Review. - Functional characterization of Anaphase Promoting Complex/Cyclosome (APC/C) E3 ubiquitin ligases in tumorigenesis.
Zhang J, Wan L, Dai X, Sun Y, Wei W. Zhang J, et al. Biochim Biophys Acta. 2014 Apr;1845(2):277-93. doi: 10.1016/j.bbcan.2014.02.001. Epub 2014 Feb 22. Biochim Biophys Acta. 2014. PMID: 24569229 Free PMC article. Review.
Cited by
- Progression of chronic liver inflammation and fibrosis driven by activation of c-JUN signaling in Sirt6 mutant mice.
Xiao C, Wang RH, Lahusen TJ, Park O, Bertola A, Maruyama T, Reynolds D, Chen Q, Xu X, Young HA, Chen WJ, Gao B, Deng CX. Xiao C, et al. J Biol Chem. 2012 Dec 7;287(50):41903-13. doi: 10.1074/jbc.M112.415182. Epub 2012 Oct 16. J Biol Chem. 2012. PMID: 23076146 Free PMC article. - Sirtuin activators and inhibitors.
Villalba JM, Alcaín FJ. Villalba JM, et al. Biofactors. 2012 Sep-Oct;38(5):349-59. doi: 10.1002/biof.1032. Epub 2012 Jun 25. Biofactors. 2012. PMID: 22730114 Free PMC article. Review. - Interactions between polyphenolic antioxidants quercetin and naringenin dictate the distinctive redox-related chemical and biological behaviour of their mixtures.
Baranowska M, Koziara Z, Suliborska K, Chrzanowski W, Wormstone M, Namieśnik J, Bartoszek A. Baranowska M, et al. Sci Rep. 2021 Jun 10;11(1):12282. doi: 10.1038/s41598-021-89314-0. Sci Rep. 2021. PMID: 34112813 Free PMC article. - The Mechanistic Roles of Sirtuins in Breast and Prostate Cancer.
Onyiba CI, Scarlett CJ, Weidenhofer J. Onyiba CI, et al. Cancers (Basel). 2022 Oct 19;14(20):5118. doi: 10.3390/cancers14205118. Cancers (Basel). 2022. PMID: 36291902 Free PMC article. Review. - Surtuin 1 as a potential prognostic biomarker in very elderly patients with colorectal cancer.
Lee GJ, Jung YH, Kim TJ, Chong Y, Jeong SW, Lee IK, Woo IS. Lee GJ, et al. Korean J Intern Med. 2021 Mar;36(Suppl 1):S235-S244. doi: 10.3904/kjim.2019.249. Epub 2020 Jul 2. Korean J Intern Med. 2021. PMID: 32605336 Free PMC article.
References
- Anand S, Penrhyn-Lowe S, Venkitaraman AR. AURORA-A amplification overrides the mitotic spindle assembly checkpoint, inducing resistance to Taxol. Cancer Cell. 2003;3:51–62. - PubMed
Publication types
MeSH terms
Substances
Grants and funding
- P50CA98131/CA/NCI NIH HHS/United States
- 1R01CA152799-01/CA/NCI NIH HHS/United States
- Z01 DK056011/ImNIH/Intramural NIH HHS/United States
- R01 CA152799/CA/NCI NIH HHS/United States
- R01 CA152601/CA/NCI NIH HHS/United States
- HHSN261200800001C/RC/CCR NIH HHS/United States
- 1R01CA152601-01/CA/NCI NIH HHS/United States
- P50 CA098131/CA/NCI NIH HHS/United States
- HHSN261200800001E/CA/NCI NIH HHS/United States
- R01 CA168292/CA/NCI NIH HHS/United States
LinkOut - more resources
Full Text Sources
Other Literature Sources
Molecular Biology Databases
Miscellaneous
