FANCJ coordinates two pathways that maintain epigenetic stability at G-quadruplex DNA - PubMed (original) (raw)
FANCJ coordinates two pathways that maintain epigenetic stability at G-quadruplex DNA
Peter Sarkies et al. Nucleic Acids Res. 2012 Feb.
Abstract
We have previously reported that DT40 cells deficient in the Y-family polymerase REV1 are defective in replicating G-quadruplex DNA. In vivo this leads to uncoupling of DNA synthesis from redeposition of histones displaced ahead of the replication fork, which in turn leads to loss of transcriptional repression due to failure to recycle pre-existing repressive histone post-translational modifications. Here we report that a similar process can also affect transcriptionally active genes, leading to their deactivation. We use this finding to develop an assay based on loss of expression of a cell surface marker to monitor epigenetic instability at the level of single cells. This assay allows us to demonstrate G4 DNA motif-associated epigenetic instability in mutants of three helicases previously implicated in the unwinding of G-quadruplex structures, FANCJ, WRN and BLM. Transcriptional profiling of DT40 mutants reveals that FANCJ coordinates two independent mechanisms to maintain epigenetic stability near G4 DNA motifs that are dependent on either REV1 or on the WRN and BLM helicases, suggesting a model in which efficient in vivo replication of G-quadruplexes often requires the established 5'-3'-helicase activity of FANCJ acting in concert with either a specialized polymerase or helicase operating in the opposite polarity.
Figures
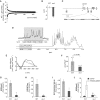
Figure 1.
Epigenetic instability in the CD72 locus of rev1 cells. (A) Plot of probe intensity differences between rev1 and WT ranked by absolute value (for probes whose expression is altered by >0.25 log2 with P < 0.05). (B) qRT-PCR confirming reduction of CD72 expression in a rev1 line independent of that used in the microarray analysis. Error bars show standard deviation. P < 0.05 (2-tailed T-test). (C) Map of the CD72 locus. The first five exons are shown as mid-gray boxes and the positions of the three G4 DNA motifs as inverted lollipops. The arrowhead within the lollipop indicates the direction that a replication fork would have to be travelling for the G-quadruplex structure to form on the leading strand template. The G4 DNA sequence (CD72-F) in the correct orientation to stall replication in rev1 cells is shown, with the dG repeats in bold. The position of the amplicon generated by the ChIP primers (_CD72_promF & R) is shown as a bar. (D) Part of the 1H NMR spectra of CD72-F. In the inset: an expansion of the spectrum focusing on the imino protons of the guanines involved in a tetrad (gray shaded area). (E) CD spectrum of CD72-F recorded in the presence of LiCl (dotted line), NaCl (dashed line) and KCl (solid line). (F) Replication efficiency of CD72-F incorporated into the leading strand template of the replicating plasmid pQ, shown as the ratio of Ampr to Kanr E. coli colonies. Ampr plasmid contains the CD72-F oligo while Kanr plasmid does not (14). The error bars represent standard error of the mean. _P_-value calculated with the unpaired _t_-test. (G) Trimethylation of H3K4 at the CD72 promoter in WT and rev1 cells. (H) Acetylation of H3K9 and K14 at the CD72 promoter in WT and rev1 cells. (I) Acetylation of the H4 N-terminal tail at the CD72 promoter in WT and rev1 cells. (J) Dimethylation of H3K9 at the CD72 and RHOGLOBIN promoters in WT and rev1 cells. Error bars in F–I represent standard error of the mean; _P-_values compared to WT (one-tailed, unpaired _t_-test): ns = not significant, *P < 0.075, **P < 0.01.
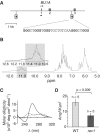
Figure 2.
G-quadruplex formation by the G-rich region of the BU-1 A locus and its defective replication in rev1 cells. (A) Map of the BU-1 A locus. The first three exons are shown as mid-gray boxes. The position of the G-rich region is shown as a lollipop and sequence of the corresponding oligonucleotide BU1A-F shown below. The arrowhead within the lollipop indicates the direction that a replication fork will be travelling in to be stalled by the G-quadruplex in rev1 cells. The position of the amplicon generated by the ChIP primers (_BU1A_promF & R) is shown as a bar. (B) Part of the 1H NMR spectra of BU1A-F. In the inset: an expansion of the spectrum focusing on the imino protons of the guanines involved in a tetrad (gray shaded area). (C) CD spectrum of BU1A-F recorded in the presence of LiCl (dotted line), NaCl (dashed line) and KCl (solid line). (D) Replication efficiency, in rev1 cells, of BU1A-F incorporated into the leading strand template of the replicating plasmid pQ, shown as the ratio of Ampr to Kanr E. coli colonies. Ampr plasmid contains the BU1A-F oligo while Kanr plasmid does not (14).
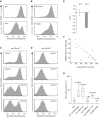
Figure 3.
Stochastic loss of surface Bu-1a in _rev1-_deficient cells. (A) A high-passage culture of rev1 cells exhibits a substantial population of Bu1a-loss variants. Flow cytometry histogram showing staining of WT and rev1 bulk populations with anti-Bu1a. (B) Constitutive loss of Bu1a from a Bu1a-positive population of rev1 cells. rev1 cells were enriched to >99% Bu1a positive by flow sorting and the population monitored for Bu1a loss at 24 h and 7 days. (C) Stochastic loss of Bu1a in Bu1a-positive subclones. Clones were expanded for 3 weeks before analysis by flow cytometry. (D) Bu1a loss is a stable phenotype. Expression of Bu1a in selected Bu1a-loss variant clones expanded for 3 weeks. (E) Reduction in Bu1a transcript in rev1 cells. qRT-PCR for Bu1a mRNA. Error bars show standard deviation. P = 0.05 (2-tailed T-test). (F) Loss of surface expression of Bu1a correlates with decreased mRNA. mRNA level in individual rev1 clones (WT = 1) assessed by qRT-PCR plotted against the percentage of cells showing negative surface Bu1a expression. (G) Complementation of the constitutive loss of Bu1a in rev1 cells by expression of full length, but not catalytically inactive hREV1. Individual Bu1a-positive subclones of each indicated genotype were expanded for 3 weeks and assessed for Bu1a loss by flow cytometry. rev1(Cambridge) and rev1(Munich) are two independently generated rev1 lines (
Table S1
). For each condition the graph shows the median (central line), range (whiskers) and interquartile range (boxes). The probability (Mann–Whitney U-test) that the distribution of loss is the same as WT is shown. NS = not significantly different. P for the difference between rev1:hREV1 and rev1:hREV1Δcat = 0.0104.
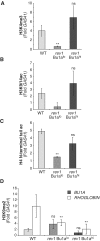
Figure 4.
Loss of Bu1a expression gene of rev1 cells correlates with loss of histone modifications associated with transcriptional activation. (A) Trimethylation of H3K4 at the BU1A promoter in WT, Bu1a-negative rev1 cells (Bu1alo) and rev1 cells enriched for expression of surface Bu1a (Bu1ahi). (B) Acetylation of H3K9 and K14 at the BU1A promoter. (C) Acetylation of the H4 N-terminal tail at the BU1A promoter (D) Dimethylation of H3K9 at the BU1A (gray bars) and ρ-GLOBIN (white bars) promoters in WT, Bu1a-negative rev1 cells (Bu1alo) and rev1 cells enriched for expression of surface Bu1a (Bu1ahi). Error bars represent standard error of the mean, _P-_values compared to WT (one-tailed, unpaired _t_-test): ns = not significant,*P < 0.075, **P < 0.01.
Figure 5.
A screen for epigenetic instability. (A) Percentage of Bu1a-loss variants in high passage clones of DT40 mutants of the indicated genotype. (B) Constitutive instability of Bu1a expression confirmed by fluctuation analysis. Subclones were expanded for 3 weeks after which the percentage of Bu1a-loss variants was determined by flow cytometry. For each condition the graph shows the median percentage Bu1a loss (central line), range (error bars) and interquartile range (boxes). The WT and rev1 data is reproduced from Figure 4G for comparison. The loss of Bu1a in lines indicated with an asterisk is significantly (P < 0.01, Mann–Whitney U-test) different to WT. (**C**) Histogram showing the number of probes statistically significantly perturbed (_P_ < 0.05) with a >0.25 log units difference in rev1, fancj, wrn, blm, wrn/blm lines compared to WT DT40.
Figure 6.
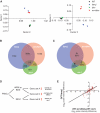
Two pathways for the maintenance of epigenetic stability at G-quadruplex forming DNA sequences. (A) PCA on microarray probes from three independently growing fancj, wrn/blm, blm and WT DT40 lines. PCA is a statistical method for explaining a complex data set in a minimum number of factors, or principal components. In this case, three orthogonal factors were sufficient to explain >98% of the variation within the data set. (B) Venn diagram showing the number of probes statistically significantly perturbed (P < 0.05) with a >0.25 log units difference to WT DT40 in rev1, fancj and wrn/blm mutants, and the overlap between these sets. All overlaps are statistically significant (see text). (C) Venn diagram as in Figure 7C showing the percentage of probes, within each set, which show the same direction of change in each pair of mutants. The expected codirectionality assuming independence between the conditions is ∼50% for each set. (D) Hypothetical relationship between FANCJ, WRN or BLM and REV1 in maintaining epigenetic stability. Sets A, B and C refer to the pairwise overlaps between the mutants shown in Figure 6C. (E) Changes in probe intensity in the fancj mutant for probes overlapping with rev1 and wrn/blm. Log2 change in fancj is plotted against the sum of the log2 change in rev1 and the log2 change in wrn/blm. The regression line is indicated (R = 0.82).
Figure 7.
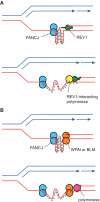
Model for the cooperation of FANCJ with REV1 and with the WRN and BLM proteins in replicating a G-quadruplex. (A) Cooperation of FANCJ with REV1. We have previously suggested that REV1 may help destabilize G-quadruplex structures (14). This could facilitate unwinding by FANCJ, which will act from the opposite side of the G-quadruplex structure. (B) Cooperation of FANCJ with WRN or BLM. Since the helicase activities of WRN and BLM helicases have the opposite polarity to FANCJ, this suggests a model by which they also act from the other end of the quadruplex, possibly simultaneously with FANCJ. DNA synthesis across the remainder of the G4 DNA sequence may then be affected by one of the replicative polymerases.
Similar articles
- Specialization among iron-sulfur cluster helicases to resolve G-quadruplex DNA structures that threaten genomic stability.
Bharti SK, Sommers JA, George F, Kuper J, Hamon F, Shin-ya K, Teulade-Fichou MP, Kisker C, Brosh RM Jr. Bharti SK, et al. J Biol Chem. 2013 Sep 27;288(39):28217-29. doi: 10.1074/jbc.M113.496463. Epub 2013 Aug 9. J Biol Chem. 2013. PMID: 23935105 Free PMC article. - FANCJ is a structure-specific DNA helicase associated with the maintenance of genomic G/C tracts.
London TB, Barber LJ, Mosedale G, Kelly GP, Balasubramanian S, Hickson ID, Boulton SJ, Hiom K. London TB, et al. J Biol Chem. 2008 Dec 26;283(52):36132-9. doi: 10.1074/jbc.M808152200. Epub 2008 Oct 31. J Biol Chem. 2008. PMID: 18978354 Free PMC article. - Assembly of a G-Quadruplex Repair Complex by the FANCJ DNA Helicase and the REV1 Polymerase.
Lowran K, Campbell L, Popp P, Wu CG. Lowran K, et al. Genes (Basel). 2019 Dec 19;11(1):5. doi: 10.3390/genes11010005. Genes (Basel). 2019. PMID: 31861576 Free PMC article. - G-quadruplexes and helicases.
Mendoza O, Bourdoncle A, Boulé JB, Brosh RM Jr, Mergny JL. Mendoza O, et al. Nucleic Acids Res. 2016 Mar 18;44(5):1989-2006. doi: 10.1093/nar/gkw079. Epub 2016 Feb 15. Nucleic Acids Res. 2016. PMID: 26883636 Free PMC article. Review. - G-quadruplex unwinding helicases and their function in vivo.
Sauer M, Paeschke K. Sauer M, et al. Biochem Soc Trans. 2017 Oct 15;45(5):1173-1182. doi: 10.1042/BST20170097. Epub 2017 Sep 22. Biochem Soc Trans. 2017. PMID: 28939694 Review.
Cited by
- Timeless couples G-quadruplex detection with processing by DDX11 helicase during DNA replication.
Lerner LK, Holzer S, Kilkenny ML, Šviković S, Murat P, Schiavone D, Eldridge CB, Bittleston A, Maman JD, Branzei D, Stott K, Pellegrini L, Sale JE. Lerner LK, et al. EMBO J. 2020 Sep 15;39(18):e104185. doi: 10.15252/embj.2019104185. Epub 2020 Jul 23. EMBO J. 2020. PMID: 32705708 Free PMC article. - Epigenome Maintenance in Response to DNA Damage.
Dabin J, Fortuny A, Polo SE. Dabin J, et al. Mol Cell. 2016 Jun 2;62(5):712-27. doi: 10.1016/j.molcel.2016.04.006. Mol Cell. 2016. PMID: 27259203 Free PMC article. Review. - Sources, resolution and physiological relevance of R-loops and RNA-DNA hybrids.
Petermann E, Lan L, Zou L. Petermann E, et al. Nat Rev Mol Cell Biol. 2022 Aug;23(8):521-540. doi: 10.1038/s41580-022-00474-x. Epub 2022 Apr 22. Nat Rev Mol Cell Biol. 2022. PMID: 35459910 Review. - G-Quadruplex-Binding Proteins: Promising Targets for Drug Design.
Shu H, Zhang R, Xiao K, Yang J, Sun X. Shu H, et al. Biomolecules. 2022 Apr 29;12(5):648. doi: 10.3390/biom12050648. Biomolecules. 2022. PMID: 35625576 Free PMC article. Review. - Duplex DNA from Sites of Helicase-Polymerase Uncoupling Links Non-B DNA Structure Formation to Replicative Stress.
Amparo C, Clark J, Bedell V, Murata-Collins JL, Martella M, Pichiorri F, Warner EF, Abdelhamid MAS, Waller ZAE, Smith SS. Amparo C, et al. Cancer Genomics Proteomics. 2020 Mar-Apr;17(2):101-115. doi: 10.21873/cgp.20171. Cancer Genomics Proteomics. 2020. PMID: 32108033 Free PMC article.
References
- Corpet A, Almouzni G. Making copies of chromatin: the challenge of nucleosomal organization and epigenetic information. Trends Cell Biol. 2009;19:29–41. - PubMed
- Bannister AJ, Zegerman P, Partridge JF, Miska EA, Thomas JO, Allshire RC, Kouzarides T. Selective recognition of methylated lysine 9 on histone H3 by the HP1 chromo domain. Nature. 2001;410:120–124. - PubMed
- Lachner M, O'Carroll D, Rea S, Mechtler K, Jenuwein T. Methylation of histone H3 lysine 9 creates a binding site for HP1 proteins. Nature. 2001;410:116–120. - PubMed
- Hansen K, Bracken A, Pasini D, Dietrich N, Gehani S, Monrad A, Rappsilber J, Lerdrup M, Helin K. A model for transmission of the H3K27me3 epigenetic mark. Nat. Cell Biol. 2008;10:1291–300. - PubMed
Publication types
MeSH terms
Substances
Grants and funding
- MC_U105178811/MRC_/Medical Research Council/United Kingdom
- 11961/CRUK_/Cancer Research UK/United Kingdom
- 11-0514/AICR_/Worldwide Cancer Research/United Kingdom
- MC_US_A024_0039/MRC_/Medical Research Council/United Kingdom
- C9681/A5709/CRUK_/Cancer Research UK/United Kingdom
- MC_U105178808/MRC_/Medical Research Council/United Kingdom
LinkOut - more resources
Full Text Sources
Research Materials
Miscellaneous
