Suppression of the imprinted gene NNAT and X-chromosome gene activation in isogenic human iPS cells - PubMed (original) (raw)
Suppression of the imprinted gene NNAT and X-chromosome gene activation in isogenic human iPS cells
Jonathan H Teichroeb et al. PLoS One. 2011.
Abstract
Genetic comparison between human embryonic stem cells and induced pluripotent stem cells has been hampered by genetic variation. To solve this problem, we have developed an isogenic system that allows direct comparison of induced pluripotent stem cells (hiPSCs) to their genetically matched human embryonic stem cells (hESCs). We show that hiPSCs have a highly similar transcriptome to hESCs. Global transcriptional profiling identified 102-154 genes (>2 fold) that showed a difference between isogenic hiPSCs and hESCs. A stringent analysis identified NNAT as a key imprinted gene that was dysregulated in hiPSCs. Furthermore, a disproportionate number of X-chromosome localized genes were over-expressed in female hiPSCs. Our results indicate that despite a remarkably close transcriptome to hESCs, isogenic hiPSCs have alterations in imprinting and regulation of X-chromosome genes.
Conflict of interest statement
Competing Interests: The authors have declared that no competing interests exist.
Figures
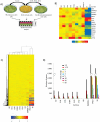
Figure 1. Derivation of re-H9 hiPSCs and their global transcriptional analysis.
(A) Schematic of derivation of EN13 and re-H9 hiPS cell lines. (B) A transcriptome heatmap putative pluripotency markers. Quantile normalized, Log2 scale, and color range has been scaled to min/max of −1/1. (C) Global hierarchical clustering of gene expression microarray data for hESC (H9), hiPSCs (re-H9, IMR90-4), and somatic (BJ, EN13) cell lines. The clustering of transcripts is determined by metric euclidean (ordinary) distance using centroid linkage (ie. Distance =  where Xa, and Xb are the gene expression levels for two separate clusters, and n, m are the number of cluster entities, respectively). Groups which minimize the average distance between respective centroids are clustered together. Similar expression profiles are initially joined into groups. These groups are further joined in a dendrogram tree structure, and the process repeated until one single group contains all data. Thus, similarity increases for groupings with nodes towards the leaves (bottom of the tree). The scale used is log2, and the color has been scaled to a min/max of −2/2. (D) Graph of gene expression differences of hiPSC (re-H9, IMR90-4) and somatic cell (BJ, EN13) lines as compared to the hESC (H9) line. The number of genes is plotted on the vertical axis vs. cell line on the horizontal axis. The selected fold differences are between 1.5 and 50 with respect to hESC line H9.
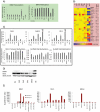
Figure 2. Altered imprinting profiles in hiPSCs.
(A) Left Plot: Results of Q-PCR analysis of the imprinted neuronatin (NNAT) gene. Right Plot: Results of methylation specific Q-PCR for NNAT promoter. The error bars give the standard error. P-values are for α = 0.05, re-H9 hiPSCs vs. mean value of H9 hESC. * above H9 if P-value is significant. (B) A transcriptome heatmap of genes with putative imprinting functions that show at least a 1.5 fold difference from hESC line H9. Status: Pd = predicted to be imprinted, I = known to be imprinted. Expressed Allele: M = maternal, P = paternal. Log2 scale, and color has been scaled to min/max of −2/2. (C) Top: The Q-PCR results of the imprinted genes in the DLK1-MEG3 region. Bottom: Results of methylation specific Q-PCR for DLK1 promoter. The error bars give the standard error. P-values are for α = 0.05, re-H9 hiPSCs vs. mean value of H9 hESC. * above H9 if P-value is significant. (D) Western blot for protein expression of NNAT and DLK1. (E) Quantile normalized value of transcript expression for NNAT and DLK1 with hESC lines H1, MAO3, H9, and hiPSC lines IMR90-1, BJ1-iPS1, EH3. Extracted from previously published microarray data collected by Biotime Inc. . The sex of each cell line is indicated.
Figure 3. Q-PCR results for other regions with putative imprinting functions.
Q-PCR analysis graphs indicate the relative expression of RNA in hESC (H9), hiPSCs (re-H9, IMR90-4) and somatic cell (BJ, EN13) lines for putatively imprinted genes with identified fold changes during transcriptional analysis. The error bars give the standard error of measurement. P-values are for α = 0.05, re-H9 hiPSCs vs. mean value of H9 hESC. * above H9 if P-value is significant.
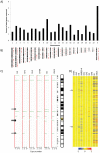
Figure 4. X-chromosome analysis of hiPSCs and H9.
(A) Graphical representation of the number of genes with two fold or greater differences in at least one re-H9 hiPSC line as compared to the hESC line H9. The percentage of measured genes with two fold differences on a given chromosome is plotted on the vertical axis vs. chromosome number on the horizontal axis. (B) Gene density maps of loci from Fig. 3A, exhibiting at least two fold differences from hESC line H9, and their approximate chromosomal locations. (C) Copy number variations for the X-chromosome from Infinium HD high resolution (median spacing 1.2 Kb). SNP microarray data plotted for hESC line H9, and randomly selected re-H9 hiPSC lines (EH1, B2, EH3, EH6A) and the somatic cell line EN13. All variations observed on the X-chromosome are deletions. Deletions are indicated by green deviations from the red HapMap baseline (copy number 2). The hESC line H9 CNVs represent our normal karyotype. Arrows indicate areas with possible de novo CNV's (deviations from normal karyotype hESC line H9). Loci of genes with 1.5 fold difference are plotted on the right for comparison, with chromosome orientation indicated. (B) A heatmap of the transcriptional profile of the X-chromosome, sorted by gene locus. Several regions of incorrectly reprogrammed genes can be visualized as a shift toward blue color as compared to hESC line H9. The scale used is Log2 and the color has been scaled to a min/max of −2/2.
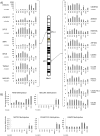
Figure 5. Q-PCR and methylation of X-chromosome dysregulated gene loci p11.4 and q24.
(A) Identified gene loci that are up-regulated compared to hESC line H9, on the X-chromosome, sorted according to their location. Q-PCR graphs of relative expressions in H9 vs. hESC (H9), hiPSCs (re-H9, IMR90-4), and somatic cell lines (BJ, EN13) for selected genes from two regions on the X-chromosome. The investigated regions p11.4, and q24 are indicated, and genes are in the order that they would be found on the chromosome. P-values are for α = 0.05, re-H9 hiPSCs vs. mean value of H9 hESC. * above H9 if P-value is significant. (B) Methylation specific Q-PCR for the genes RPGR, MID1IP1, MCTS1, C1GALT1C1 and LAMP2 promoters are presented below the Q-PCR results of their respective regions. P-values are for α = 0.05, re-H9 hiPSCs vs. mean value of H9 hESC. * above H9 if P-value is significant.
Similar articles
- Clone- and gene-specific aberrations of parental imprinting in human induced pluripotent stem cells.
Pick M, Stelzer Y, Bar-Nur O, Mayshar Y, Eden A, Benvenisty N. Pick M, et al. Stem Cells. 2009 Nov;27(11):2686-90. doi: 10.1002/stem.205. Stem Cells. 2009. PMID: 19711451 - Comparison of the molecular profiles of human embryonic and induced pluripotent stem cells of isogenic origin.
Mallon BS, Hamilton RS, Kozhich OA, Johnson KR, Fann YC, Rao MS, Robey PG. Mallon BS, et al. Stem Cell Res. 2014 Mar;12(2):376-86. doi: 10.1016/j.scr.2013.11.010. Epub 2013 Dec 4. Stem Cell Res. 2014. PMID: 24374290 Free PMC article. - Persistent donor cell gene expression among human induced pluripotent stem cells contributes to differences with human embryonic stem cells.
Ghosh Z, Wilson KD, Wu Y, Hu S, Quertermous T, Wu JC. Ghosh Z, et al. PLoS One. 2010 Feb 1;5(2):e8975. doi: 10.1371/journal.pone.0008975. PLoS One. 2010. PMID: 20126639 Free PMC article. - Genome imprinting in stem cells: A mini-review.
Godini R, Karami K, Fallahi H. Godini R, et al. Gene Expr Patterns. 2019 Dec;34:119063. doi: 10.1016/j.gep.2019.119063. Epub 2019 Jul 4. Gene Expr Patterns. 2019. PMID: 31279979 Review. - Epigenetic aberrations in human pluripotent stem cells.
Bar S, Benvenisty N. Bar S, et al. EMBO J. 2019 Jun 17;38(12):e101033. doi: 10.15252/embj.2018101033. Epub 2019 May 14. EMBO J. 2019. PMID: 31088843 Free PMC article. Review.
Cited by
- Recurrent variations in DNA methylation in human pluripotent stem cells and their differentiated derivatives.
Nazor KL, Altun G, Lynch C, Tran H, Harness JV, Slavin I, Garitaonandia I, Müller FJ, Wang YC, Boscolo FS, Fakunle E, Dumevska B, Lee S, Park HS, Olee T, D'Lima DD, Semechkin R, Parast MM, Galat V, Laslett AL, Schmidt U, Keirstead HS, Loring JF, Laurent LC. Nazor KL, et al. Cell Stem Cell. 2012 May 4;10(5):620-34. doi: 10.1016/j.stem.2012.02.013. Cell Stem Cell. 2012. PMID: 22560082 Free PMC article. - Solving the "X" in embryos and stem cells.
Bermejo-Alvarez P, Ramos-Ibeas P, Gutierrez-Adan A. Bermejo-Alvarez P, et al. Stem Cells Dev. 2012 May 20;21(8):1215-24. doi: 10.1089/scd.2011.0685. Epub 2012 Mar 6. Stem Cells Dev. 2012. PMID: 22309156 Free PMC article. Review. - iPSC-Based cell therapy: an important step forward.
Rao M. Rao M. Stem Cell Reports. 2013 Oct 15;1(4):281-2. doi: 10.1016/j.stemcr.2013.10.002. eCollection 2013. Stem Cell Reports. 2013. PMID: 24319663 Free PMC article. - Heterodisomy in the GNAS locus is also a cause of pseudohypoparathyroidism type 1B (iPPSD3).
Manero-Azua A, Vado Y, Gonzàlez Morlà J, Mogas E, Pereda A, Perez de Nanclares G. Manero-Azua A, et al. Front Endocrinol (Lausanne). 2024 Dec 16;15:1505244. doi: 10.3389/fendo.2024.1505244. eCollection 2024. Front Endocrinol (Lausanne). 2024. PMID: 39736869 Free PMC article. - Derivation conditions impact X-inactivation status in female human induced pluripotent stem cells.
Tomoda K, Takahashi K, Leung K, Okada A, Narita M, Yamada NA, Eilertson KE, Tsang P, Baba S, White MP, Sami S, Srivastava D, Conklin BR, Panning B, Yamanaka S. Tomoda K, et al. Cell Stem Cell. 2012 Jul 6;11(1):91-9. doi: 10.1016/j.stem.2012.05.019. Cell Stem Cell. 2012. PMID: 22770243 Free PMC article.
References
- Takahashi K, Tanabe K, Ohnuki M, Narita M, Ichisaka T, et al. Induction of pluripotent stem cells from adult human fibroblasts by defined factors. Cell. 2007;131:861–872. - PubMed
- Yu J, Vodyanik MA, Smuga-Otto K, Antosiewicz-Bourget J, Frane JL, et al. Induced Pluripotent Stem Cell Lines Derived from Human Somatic Cells. Science. 2007;318:1917–1920. - PubMed
- Feng Q, Lu SJ, Klimanskaya I, Gomes I, Kim D, et al. Hemangioblastic derivatives from human induced pluripotent stem cells exhibit limited expansion and early senescence. Stem Cells. 2010;28:704–712. - PubMed
- Vaziri H, Chapman KB, Guigova A, Teichroeb J, Lacher MD, et al. Spontaneous reversal of the developmental aging of normal human cells following transcriptional reprogramming. Regen Med. 2010;5:345–363. - PubMed
Publication types
MeSH terms
Substances
LinkOut - more resources
Full Text Sources
Molecular Biology Databases


