Erythropoietin and Wnt1 govern pathways of mTOR, Apaf-1, and XIAP in inflammatory microglia - PubMed (original) (raw)
Erythropoietin and Wnt1 govern pathways of mTOR, Apaf-1, and XIAP in inflammatory microglia
Yan Chen Shang et al. Curr Neurovasc Res. 2011 Nov.
Abstract
Inflammatory microglia modulate a host of cellular processes in the central nervous system that include neuronal survival, metabolic fluxes, foreign body exclusion, and cellular regeneration. Elucidation of the pathways that oversee microglial survival and integrity may offer new avenues for the treatment of neurodegenerative disorders. Here we demonstrate that erythropoietin (EPO), an emerging strategy for immune system modulation, prevents microglial early and late apoptotic injury during oxidant stress through Wnt1, a cysteine-rich glycosylated protein that modulates cellular development and survival. Loss of Wnt1 through blockade of Wnt1 signaling or through the gene silencing of Wnt1 eliminates the protective capacity of EPO. Furthermore, endogenous Wnt1 in microglia is vital to preserve microglial survival since loss of Wnt1 alone increases microglial injury during oxidative stress. Cellular protection by EPO and Wnt1 intersects at the level of protein kinase B (Akt1), the mammalian target of rapamycin (mTOR), and p70S6K, which are necessary to foster cytoprotection for microglia. Downstream from these pathways, EPO and Wnt1 control "anti-apoptotic" pathways of microglia through the modulation of mitochondrial membrane permeability, the release of cytochrome c, and the expression of apoptotic protease activating factor-1 (Apaf-1) and X-linked inhibitor of apoptosis protein (XIAP). These studies offer new insights for the development of innovative therapeutic strategies for neurodegenerative disorders that focus upon inflammatory microglia and novel signal transduction pathways.
Figures
Fig. (1). EPO is necessary to foster protection in microglia during OGD exposure
(A) Microglia was exposed to OGD for 4, 6, 8 and 12 hours and cell survival was determined 24 hours after OGD by using trypan blue exclusion method. Representative images illustrate that OGD leads to progressively increased microglial injury over time. Control = untreated microglia. (B) Quantitative analysis shows that microglial survival was significantly decreased following OGD exposure when compared with untreated control cultures (*P <0.01 vs. Control). Each data point represents the mean and SEM from 6 experiments. (C and D) EPO was applied to microglial cultures at the concentrations of 0.01, 0.1, 1,10, 50, and 100 ng/ml 1 hour prior to OGD and cell survival was determined 24 hours after OGD with the trypan blue dye exclusion method. Representative images show that EPO (1–100 ng/ml) significantly reduced trypan blue staining and increased cell survival following OGD (*P<0.01 vs. untreated control; †P <0.05 vs. OGD). Each data point represents the mean and SEM from 6 experiments. (E) EPO was applied to microglial cultures 24, 12, 6 or 1 hour prior to a 6 hour period of OGD and cell survival was determined 24 hours after OGD with the trypan blue dye exclusion method. The quantitative results show that 1 hour is the most effective pretreatment time with maximal survival achieved after EPO application (*P<0.01 vs. untreated control; †P <0.05 vs. OGD). Each data point represents the mean and SEM from 6 experiments. (F) Representative images demonstrate that OGD led to a significant increase in trypan blue staining, DNA fragmentation, and membrane PS exposure in microglia at 24 hours after OGD compared to untreated control cultures, which was prevented by EPO (10 ng/ml) application. Yet, inhibition of EPO with an EPO blocking antibody (EPO Ab, 2 µg/ml) abrogates the efficacy of EPO on cell survival and apoptotic injury. (G) Quantification of the results in F illustrate that EPO (10 ng/ml) application significant decreased percent trypan blue uptake, DNA fragmentation, and membrane PS exposure 24 hours after OGD when compared to OGD treated alone. Inhibition of EPO with EPO Ab (2 µg/ml) diminishes the efficacy of EPO with a decrease in cell survival and an increase in percent apoptotic DNA fragmentation and PS exposure (*P < 0.01 vs. untreated control; †P <0.05 vs. OGD). Each data point represents the mean and SEM from 6 experiments.
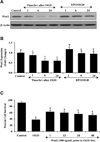
Fig. (2). EPO maintains the expression of Wnt1 and the highest microglial survival occurs with early Wnt1 application
(A and B) Microglial protein extracts (50 µg/lane) were immunoblotted with anti-Wnt1 at 1, 6 and 24 hours after OGD. Wnt1 expression was progressively reduced over 24 hours after OGD exposure (*P<0.01 vs. control). In contrast, EPO (10 ng/ml) given 1 hour prior to OGD significantly increased Wnt1 expression at 1, 6 and 24 hours respectively compared with OGD alone (†P <0.01 vs. OGD). (C) Wnt1 was applied to microglial cultures 1, 12, 24, or 48 hours prior to a 6 hour period of OGD and cell survival was determined 24 hours after OGD with the trypan blue dye exclusion method. Wnt1 application significantly increased cell survival 24 hours following OGD with maximal efficacy with a 1 hour pretreatment (*P<0.01 vs. untreated control; †P <0.01 vs. OGD). Each data point represents the mean and SEM from 3 experiments.
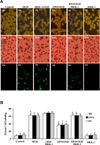
Fig. (3). Wnt1 antibody administration decreases the ability of EPO and Wnt1 to protect microglia against OGD
(A) Microglial cells were exposed to OGD for 6 hours and cell survival, DNA fragmentation, and PS exposure were determined 24 hours after OGD with the trypan blue dye exclusion method, TUNEL, and annexin V labeling method respectively. Representative images illustrate that Wnt1 (100 ng/ml) and EPO (10 ng/ml) administration during OGD significantly reduced trypan blue staining, genomic DNA degradation, and membrane PS externalization (green fluorescence). In contrast, blockade of Wnt1 with Wnt1 Ab (1 µg/ml) resulted in increased trypan blue staining, DNA fragmentation, and membrane PS exposure and also attenuated the protective ability of EPO. Combined Wnt1 and EPO application yielded a similar protection to EPO applied only during OGD. (B) Quantification of data illustrates that percent trypan blue staining, DNA fragmentation, and membrane PS externalization were significantly increased following a 6 hour period of OGD when compared to untreated microglial control cultures, but Wnt1 (100 ng/ml), EPO (10 ng/ml), or EPO/Wnt1 combined therapy increased cell survival and prevented DNA fragmentation and membrane PS exposure during OGD. Inhibition of Wnt1 with Wnt1 Ab (1µg/ml) abrogates the efficacy of EPO during OGD (*P < 0.01 vs. untreated control; †P < 0.01 vs. OGD). Each data point represents the mean and SEM from 6 experiments.
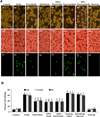
Fig. (4). Wnt antagonist DKK-1 blocks protection by EPO during OGD
(A) Microglial cells were exposed to OGD for 6 hours and cell survival, DNA fragmentation, and PS exposure were determined 24 hours after OGD with the trypan blue dye exclusion method, TUNEL, and annexin V labeling respectively. Representative images illustrate that EPO (10 ng/ml) administration during OGD significantly reduced trypan blue staining, genomic DNA degradation, and membrane PS externalization (green fluorescence). In contrast, blockade of Wnt cell signaling with DKK-1 (500 ng/ml) resulted in increased trypan blue staining, DNA fragmentation, and membrane PS exposure and also blocked protection by EPO during OGD exposure. DKK-1 (500 ng/ml) application alone to microglial cultures increased cell injury during OGD. (B) Quantification of data illustrates that percent trypan blue staining, DNA fragmentation, and membrane PS externalization were significantly increased following a 6 hour period of OGD when compared to untreated microglial control cultures, but EPO (10 ng/ml) increased cell survival and prevented apoptotic DNA fragmentation and membrane PS exposure during OGD. DKK-1 application abrogates the protective capacity of EPO during OGD (*P < 0.01 vs. untreated control; †P < 0.01 vs. OGD). Each data point represents the mean and SEM from 6 experiments (*P < 0.01 vs. untreated control; †P < 0.01 vs. OGD).
Fig. (5). Gene silencing of Wnt1 abrogates the protective capacity of EPO against OGD
(A and B) Gene silencing of Wnt1 was performed with transfection of Wnt1 siRNA prior to OGD in microglia. Wnt1 expression was determined at 6 hours following a 6 hour period of OGD. Transfection with Wnt1 siRNA significantly reduced expression of Wnt1 following a 6 hour period of OGD or during EPO (10 ng/ml) application with OGD, but non-specific scrambled siRNA did not alter Wnt1 expression (*P < 0.01 vs. OGD). In B, western band intensity was performed using the public domain NIH image program (
http://rsb.info.nih.gov/nih-image
). (C) Gene silencing of Wnt1 was performed with transfection of Wnt1 siRNA prior to OGD in microglia and cell survival was determined by using trypan blue dye exclusion method 24 hours following a 6 hour period of OGD. Transfection with Wnt1 siRNA significantly increased cell staining during OGD and prevented protection by EPO (10 ng/ml) during OGD exposure resulting in increased trypan blue staining. Non-specific scrambled siRNA did not alter trypan blue staining during OGD. (D) Transfection with Wnt1 siRNA in microglia prior to OGD significantly reduced cell survival and blocked the ability of EPO (10 ng/ml) to protect microglia during OGD (*P < 0.01 vs. untreated control; †P<0.01 vs. OGD). Each data point represents the mean and SEM from 6 experiments.
Fig. (6). EPO activates Akt1 and employs mTOR to protect microglia against OGD
(A) Microglial protein extracts (50 µg/lane) were immunoblotted with p-Akt1 (active form) at 6, 12, and 24 hours following a 6 hour period of OGD. OGD resulted in a slight increase in the expression of p-Akt1 but was progressively lost over a 24 hour period. EPO (10 ng/ml) with a 1 hour pretreatment significantly increased the expression of p-Akt1 (*P <0.01 vs. Control; †P<0.01 vs. OGD of corresponding time point). In all cases, each data point represents the mean and SEM from 6 experiments. (B) The activity of Akt1 was determined by assessing the expression of p-GSK-3α/β after incubation of the substrate GSK-3 infusion protein with protein extracts from microglia following OGD. EPO (10 ng/ml) with 1 hour pretreatment significantly increased the activity of Akt1 over 24 hours following a 6 hour period of OGD (*P <0.01 vs. Control; †P<0.01 vs. OGD of corresponding time point). In all cases, each data point represents the mean and SEM from 6 experiments. (C) Microglial protein extracts (50 µg/lane) were immunoblotted with phosphorylated (p)-mTOR (Ser2448) and p-p70S6K (Th389) antibodies at 6, 12, and 24 hours following a 6 hour period of OGD. OGD resulted in a slight increase in the expression of p-mTOR and p-p70S6K, but a 1 hour pretreatment with EPO (10 ng/ml) significantly increased and maintained the expression of p-mTOR and p-p70S6K over a 24 hour period following OGD exposure (*P <0.01 vs. Control; †P<0.01 vs. OGD of corresponding time point). In all cases, each data point represents the mean and SEM from 3 experiments. (D) EPO (10 ng/ml) or Wnt1 (100 ng/ml) was applied to microglial cultures 1 hour prior to a 6 hour period of OGD and cell survival was determined 24 hours following OGD by using trypan blue dye exclusion method. Representative pictures demonstrate that EPO or Wnt1 application significantly reduced trypan blue staining following OGD. Application of the mTOR specific inhibitor rapamycin (RAPA, 20 nM) combined with EPO (10 ng/ml) administration blocked protection by EPO resulting in an increased staining of trypan blue in microglia. (E) Quantification of data illustrates that microglial cell survival was significantly decreased 24 hours following a 6 hour period of OGD when compared to untreated microglial control cultures. In contrast, EPO (10 ng/ml), Wnt1 (100 ng/ml) or EPO combined with Wnt1 administration significantly increased cell survival to a similar level. In contrast, the mTOR specific inhibitors rapamycin (RAPA, 20 ng/ml) or Ku 0063794 (KU, 100 ng/ml) blocked protection by EPO, Wnt1 or EPO combined with Wnt1 during OGD resulting in a decrease in microglial cell survival (*P < 0.01 vs. untreated control; †P < 0.01 vs. OGD). Each data point represents the mean and SEM from 6 experiments.
Fig. (7). EPO through Wnt1 inhibits mitochondrial depolarization and subsequent cytochrome c release and modulates the expression of Apaf-1 and XIAP
(A) OGD produced a significant decrease in the red/green fluorescence intensity ratio of mitochondria using a cationic membrane potential indicator JC-1 within 6 hours when compared with untreated control cultures demonstrating that OGD results in mitochondrial membrane depolarization. EPO (10 ng/ml) or Wnt1 (100 ng/ml) application during OGD prevented mitochondrial depolarization and significantly increased the red/green fluorescence intensity of mitochondria in microglia. In contrast, inhibition of Wnt1 with transfection of Wnt1 siRNA (siRNA) increased mitochondrial membrane depolarization to a greater degree than OGD alone and blocked the ability of EPO to prevent mitochondrial depolarization during OGD. The relative ratio of red/green fluorescent intensity of mitochondrial staining was measured in 6 independent experiments with analysis performed using the public domain NIH Image program (
http://rsb.info.nih.gov/nih-image
) (untreated microglia = Control, *P<0.01 vs. OGD; †P <0.01 vs. EPO/OGD). (B) Equal amounts of mitochondrial (Mito) or cytosol (Cyto) protein extracts (50 µg/lane) were immunoblotted demonstrating that EPO or Wnt1 administration significantly prevented cytochrome c release from mitochondria during OGD (*P<0.01 vs. OGD; †P <0.01 vs. EPO/OGD). Transfection with Wnt1 siRNA blocked the ability of EPO to prevent mitochondrial release of cytochrome c. Non-specific scrambled siRNA did not affect mitochondrial depolarization. Each data point represents the mean and SEM from 6 experiments. (C) Microglial protein extracts (50 µg/lane) were immunoblotted with Apaf-1 and XIAP antibodies 6, 12, and 24 hours following OGD. OGD significantly increased Apaf-1 and significantly decreased XIAP expression. In contrast, EPO (10 ng/ml) application decreased Apaf-1 and increased XIAP expression following OGD (*P <0.01 vs. Control; †P<0.01 vs. OGD). In all cases, each data point represents the mean and SEM from 3 experiments.
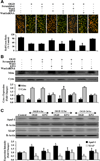
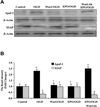
Fig. (8). EPO requires Wnt1 to govern expression of Apaf-1 and XIAP in microglia during OGD
Microglial protein extracts (50 µg/lane) were immunoblotted with Apaf-1 and XIAP antibodies 6 hours following a 6 hour period of OGD exposure. (A and B) A representative Western blot demonstrates that OGD exposure significantly increased Apaf-1 and significantly decreased XIAP expression. Application of EPO (10 ng/ml) 1 hour prior to OGD significantly decreased Apaf-1 and significantly increased XIAP expression following OGD. In addition, Wnt1 is necessary for EPO to control Apaf-1 and XIAP expression since application of Wnt1 Ab (1 µg/ml) with EPO blocks the ability of EPO during OGD exposure to decrease Apaf-1 expression (Figs. 8A and 8B) and increase XIAP expression. In B, quantification of western band intensity was performed using the public domain NIH Image program (
http://rsb.info.nih.gov/nih-image
) (*P <0.01 vs. Control; †P<0.01 vs. OGD). In all cases, each data point represents the mean and SEM from 3 experiments.
Similar articles
- Vascular injury during elevated glucose can be mitigated by erythropoietin and Wnt signaling.
Chong ZZ, Shang YC, Maiese K. Chong ZZ, et al. Curr Neurovasc Res. 2007 Aug;4(3):194-204. doi: 10.2174/156720207781387150. Curr Neurovasc Res. 2007. PMID: 17691973 Free PMC article. - Prevention of β-amyloid degeneration of microglia by erythropoietin depends on Wnt1, the PI 3-K/mTOR pathway, Bad, and Bcl-xL.
Shang YC, Chong ZZ, Wang S, Maiese K. Shang YC, et al. Aging (Albany NY). 2012 Mar;4(3):187-201. doi: 10.18632/aging.100440. Aging (Albany NY). 2012. PMID: 22388478 Free PMC article. - Wnt1, FoxO3a, and NF-kappaB oversee microglial integrity and activation during oxidant stress.
Shang YC, Chong ZZ, Hou J, Maiese K. Shang YC, et al. Cell Signal. 2010 Sep;22(9):1317-29. doi: 10.1016/j.cellsig.2010.04.009. Epub 2010 May 10. Cell Signal. 2010. PMID: 20462515 Free PMC article. - Erythropoietin: new directions for the nervous system.
Maiese K, Chong ZZ, Shang YC, Wang S. Maiese K, et al. Int J Mol Sci. 2012;13(9):11102-11129. doi: 10.3390/ijms130911102. Epub 2012 Sep 6. Int J Mol Sci. 2012. PMID: 23109841 Free PMC article. Review. - Targeting WNT, protein kinase B, and mitochondrial membrane integrity to foster cellular survival in the nervous system.
Chong ZZ, Maiese K. Chong ZZ, et al. Histol Histopathol. 2004 Apr;19(2):495-504. doi: 10.14670/HH-19.495. Histol Histopathol. 2004. PMID: 15024710 Free PMC article. Review.
Cited by
- Wnt1 inducible signaling pathway protein 1 (WISP1) targets PRAS40 to govern β-amyloid apoptotic injury of microglia.
Shang YC, Chong ZZ, Wang S, Maiese K. Shang YC, et al. Curr Neurovasc Res. 2012 Nov;9(4):239-49. doi: 10.2174/156720212803530618. Curr Neurovasc Res. 2012. PMID: 22873724 Free PMC article. - Dysregulation of metabolic flexibility: The impact of mTOR on autophagy in neurodegenerative disease.
Maiese K. Maiese K. Int Rev Neurobiol. 2020;155:1-35. doi: 10.1016/bs.irn.2020.01.009. Epub 2020 Aug 11. Int Rev Neurobiol. 2020. PMID: 32854851 Free PMC article. Review. - Focal brain inflammation and autism.
Theoharides TC, Asadi S, Patel AB. Theoharides TC, et al. J Neuroinflammation. 2013 Apr 9;10:46. doi: 10.1186/1742-2094-10-46. J Neuroinflammation. 2013. PMID: 23570274 Free PMC article. Review. - Cognitive Impairment in Multiple Sclerosis.
Maiese K. Maiese K. Bioengineering (Basel). 2023 Jul 23;10(7):871. doi: 10.3390/bioengineering10070871. Bioengineering (Basel). 2023. PMID: 37508898 Free PMC article. Review. - Satureja khuzistanica Jamzad essential oil prevents doxorubicin-induced apoptosis via extrinsic and intrinsic mitochondrial pathways.
Seyedan AA, Dezfoulian O, Alirezaei M. Seyedan AA, et al. Res Pharm Sci. 2020 Oct 19;15(5):481-490. doi: 10.4103/1735-5362.297851. eCollection 2020 Oct. Res Pharm Sci. 2020. PMID: 33628290 Free PMC article.
References
- Chong ZZ, Li F, Maiese K. Oxidative stress in the brain: Novel cellular targets that govern survival during neurodegenerative disease. Prog Neurobiol. 2005 Feb;75(3):207–246. - PubMed
- Salminen A, Kaarniranta K. Siglec receptors and hiding plaques in Alzheimer's disease. J Mol Med. 2009 Jul;87(7):697–701. - PubMed
Publication types
MeSH terms
Substances
Grants and funding
- R01 NS053946-05/NS/NINDS NIH HHS/United States
- R01 NS053946-04/NS/NINDS NIH HHS/United States
- P30 ES06639/ES/NIEHS NIH HHS/United States
- R01 NS053946-01A2/NS/NINDS NIH HHS/United States
- R01 NS053946-03S1/NS/NINDS NIH HHS/United States
- P30 ES006639/ES/NIEHS NIH HHS/United States
- R01 NS053946-06/NS/NINDS NIH HHS/United States
- R01 NS053946-02/NS/NINDS NIH HHS/United States
- R01 NS053946/NS/NINDS NIH HHS/United States
- R01 NS053946-03/NS/NINDS NIH HHS/United States
- R01 NS053946-05S1/NS/NINDS NIH HHS/United States
LinkOut - more resources
Full Text Sources
Research Materials
Miscellaneous

